Anatomy of a spool
Introduction
SQL Server uses a few “spool” operators in execution plans. They are known as Table Spool, Index Spool, Row Count Spool, and Window Spool. The first two are very similar. Both store the data they process in a worktable, that they can then later read back to produce the same rows multiple times, or in multiple locations in the plan.
The information in the Execution Plan Reference should be as complete and as correct as possible. But I was unable to find any in-depth description of how exactly these spool operators store their data. There are many sources to confirm that this is in tempdb, and that the I/O for this is reported in SET STATISTICS IO as “Worktable”, but that’s about it. I was unable to find any documentation or description of how this worktable is structured for a Table Spool. And for an Index Spool, the only information I found (here) is that it places the data in “a hidden spool file (…) and builds a nonclustered index on the rows”.
This was not sufficient detail for me. I wanted to know more. This article describes my efforts to find this information. I wrote this for a few reasons. I had an awesome journey and I want to share my excitement. But I also want people to be able to verify the statements I make about undocumented features in the Execution Plan Reference. And, who knows? Maybe this article inspires other people to do other interesting investigations, or to double check my experiments and then perhaps they see some details that I have overlooked.
TL;DR – for the impatient reader
This article is long. If you are interested in how exactly I found investigated the structure of worktables used by spool operators, or if you want to check that I didn’t make any mistakes (and please do, I am a very experienced mistake-maker!), then you will have to read it.
But if you are only interested in the conclusions, then here they are:
A Table Spool operator stores its data in a worktable that is structured as a clustered index. The index is not built on any of the columns in the data, nor on any artificially added columns. It is structured on zero columns. As is normal for a clustered index on a set of columns that is not unique for the set, a 4-byte uniqueifier is then added to the data to give each row a unique internal address.
The worktable for an Index Spool operator is also structured as a clustered index. However, this operator does actually index actual columns from its data instead of just relying on a uniqueifier. The indexed columns are chosen to effectively satisfy the Seek Predicate property. The statement in the Microsoft’s documentation that a nonclustered index is used for Index Seek is not correct.
A stack spool is represented in execution plans as a combination of an Index Spool and a Table Spool, both with the With Stack property present and set to True. This is misleading because it is actually a different type of spool. The worktable it uses is built as a clustered index on a single column, representing the nesting level. Because this is not unique, a uniqueifier is added where needed.
Credits
Before I even start to describe the steps I followed, I want to include a shout out to the people that have helped me. I got stuck a few times along the way. When I started asking some (perhaps silly looking) questions on Twitter, using the #sqlhelp hashtag, I got responses from lots of people. I did not track exactly which suggestions I used how much of, because I equally appreciated all the replies I got. So here are in alphabetical order all the people who helped me by responding to my questions:
Taiob Ali, Denny Cherry, Ewald Cress, Reitske Eskens, Mötz Jensen, Jayanth Kurup, John Q Martin, Ekrem Önsoy, Pat Phelan, Kennie N Pontoppidan, and Randolph West.
I also found a lot of help, inspiration, and useful information from various non-twitter sources. Some of these I found because of the people above, others through the almighty Google or because I already knew them from earlier work. This list, again, is in alphabetical order:
- Kalen Delaney wrote lots of books on SQL Server internals. I was glad I still own (and treasure!) my heavily used copy of “Inside Microsoft SQL Server 2005: The Storage Engine” when I was trying to decipher some of the row structures I found when looking at
DBCC PAGE - Patrick Flynn posted a script (attributed to Steve Stedman) to capture and parse some of the data returned by
DBCC PAGE. Especially when looking at large numbers of pages, this script (modified as needed) can save a lot of time! - Paul Randal has posted tons of material about storage engine internals to both his old and new blog. I found a lot of useful information on this page and on this page.
- Bob Ward wrote the post that told me how to recognize when a page is allocated to a worktable, and that pointed to the only (?) place where these allocations are tracked.
The setup
Worktables are stored in tempdb. So that’s where I need to look if I want to somehow reverse engineer their structure. Of course the best practice for tempdb is to use multiple data files. And though performance of the playground SQL Server instances on my laptop is not really an issue, I have always followed this recommendation.
When researching these very volatile data structures, those extra files make the already complex process a lot harder. So I moved away from my normal instance and instead installed a new SQL Server instance, ignoring the normal advice and overriding the installation defaults, with just one single data file for tempdb. The file size I used is 10 MB – large enough for all the experiments so far, but not overly large as that might, again, add further complications to some of the steps.
To find pages allocated to worktables, I frequently compared the results of the same query at different times. But I found that this gets harder and harder when working for extended periods. Apparently, pages allocated to worktables are not immediately returned to the pool of free pages when the query ends. They remain allocated and are then reused when another query needs a worktable (I don’t know if there is a time limit after which they are eventually released). To make sure I always can see which pages are allocated when I run a query, I now always restart the instance in between experiments. That gives me a clean tempdb at the start, so I don’t miss new allocations.
Freeze that worktable!
Trying to find a worktable poses some unique challenges. The first is that they only exist for the duration of a query; after that the pages can be reused (even when I do nothing else because of background processes). Dissecting pages takes time and I need the contents to be stable during that time. Most queries don’t run long enough for that, so I need to “freeze” a query while I am investigating its worktable.
One option I considered is to interrupt and pause the SQL Server process with a debugger. But I am neither Paul White, nor Bob Ward. I have never used a debugger and have no idea how to even get started. Plus, when the SQL Server is paused I cannot use DBCC PAGE to check the pages. Given the volatile nature of worktables it is very unlikely that they are ever flushed to disk, so that means that this method adds the additional challenge of finding the page in the buffer pool. Not my cup of tea.
Instead I found a method to freeze a query using only tools supplied directly within SQL Server itself. Pessimistic concurrency (also known as locking) turned out to be great tool for this.
For each scenario I want to investigate, I first write a query that has the required spool operator in its execution plan. I then create a table that can store the results of that query, rewrite the query as an INSERT ... SELECT query, and verify how this affects the execution plan – it is possible for the plan to change such that the spool is no longer used, in which case I have to go back to the drawing board and find a more suitable query.
The next step is then to open a second query window, start a transaction, and insert a row into that new table. Not just any row – a row with a primary key value that also occurs in the results of the query. The goal here is not to cause a runtime error, but to cause a locking conflict. So I don’t commit (or rollback) the transaction in this window, but leave it open. I then switch back to my test query, enable the Live Query Statistics feature, and run the query. If I have done everything right, I’ll see the query run and then stop; the Live Query Statistics window shows me exactly how many rows each operator has processed. I use this to verify that the spool operator has loaded its data (or the expected subset of it) in the worktable at the point in time where the query is blocked. Now I can investigate data structures as long as I want, because this execution plan is not going to do anything until I rollback the other transaction.
At this point I have my test scripts. But I don’t want to investigate with all the overhead of the Live Query Statistics (I don’t know if they influence tempdb, I just didn’t want to risk it). So I now stop and restart the instance (to start with a clean tempdb data file), switch off all Live Query Statistics and Actual Execution Plan options, and then rerun the scripts. And then I can start digging into the data structures.
In the rest of the article, I use the term “freeze a query” to refer to the process of running the query after first starting a transaction with a blocking query in another window, to ensure that the query cannot finish and its worktables remain in place and unchanged as long as I want. And I always do this on a freshly restarted instance, and with the Live Query Statistics and Actual Execution Plan options disabled in all windows (even though this may not always be required).
Where’s Wally?
Freezing a query turned out to be just the first step. The next step is to find the data. I can’t just run SELECT * FROM <worktable>. But DBCC PAGE is a powerful instrument, if you know which pages to inspect. So I just need to find them, right? Should be easy: just query sys.sysindexes (yes, I know that this DMV is deprecated, but until I find a replacement that allows me to find the first, firstiam and root columns without requiring a million joins, I’ll use it in scenarios such as this), freeze a query that uses a spool, then query sys.sysindexes again and check the differences.
Except … there were no differences! Apparently, either worktable objects are not recorded at all in sys.sysindexes, or they are filtered out when you query the table. I know that sys.sysindexes is not actually a system table anymore, but a view on the underlying base system tables – so to check whether worktables are hidden by using a filter I first query sys.sysindexes with the Include Actual Execution Plan option enabled to see where it gets its data from. Here is the plan:
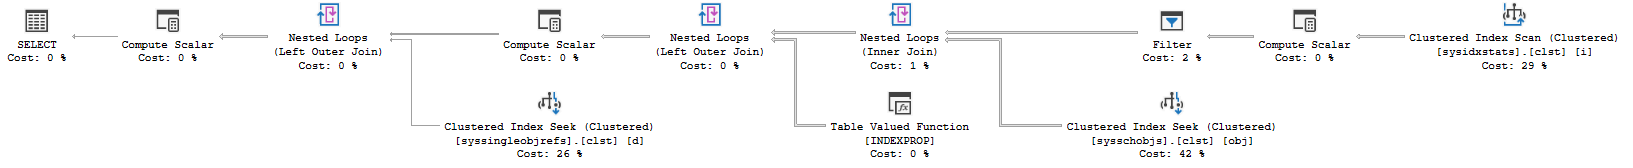
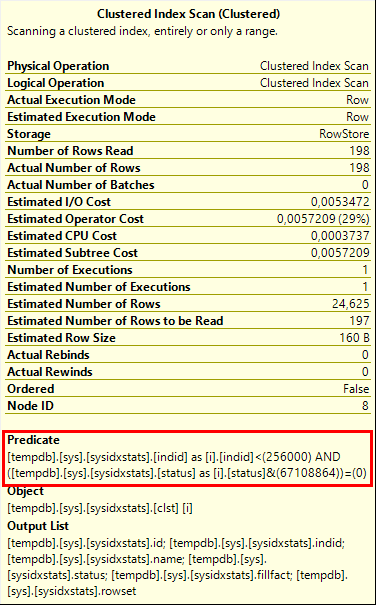
There are several places in this execution plan where a row that is stored in the actual system tables can be filtered out. The most likely candidates are the Filter operator and the Clustered Index Scan on index sysidxstats.clst to the far right, which has a filter pushed into its Predicate property (as shown in figure 2).
I once more queried sys.sysindexes, froze the query with the spool, and re-queried sys.sysindexes, this time in order to compare the Actual Number of Rows property of all operators in the execution plan above. It turns out that all of them are the same. So if the worktable is registered in the base system tables but hidden in the sys.sysindexes query, it must be filtered out by the pushed-down predicate on sysidxstats.
My next idea was to find a way to access ALL data in sysidxstats. And that’s not easy, as there is no simple way to query base system tables directly! (It is possible using the DAC (Dedicated Administrator Connection), but only one such connection is allowed and in order to compare before and after states I always want to run the query from two windows, so I can Ctrl-Tab to compare the before and after results).
However, with enough determination (and permissions!) one can also read the data in the base system tables without needing the DAC at all. And that’s because, even though the content of the base tables cannot be normally accessed, their metadata is exposed in the regular system views.
SELECT  s.id, s.name, s.indid, s.dpages,
        s.first, s.root, s.FirstIAM
FROM    sys.sysindexes AS s
WHERE   s.id = OBJECT_ID('sys.sysidxstats');
Listing 1: Find base system table in sys.sysindexes
I executed the query in listing 1 and SQL Server responded with these results:

Smart people never query sys.sysindexes, so smart people have no clue what any of the results in figure 3 mean. But I’m not smart, so I do understand it. The sysidxstats base system table apparently has a clustered index (named clst), a nonclustered index (named nc – someone at Microsoft was not very creative), and two automatically created column statistics. I want to see all the data so I only care about the clustered index. It has four data pages, and I can immediately see the locations of the first data page (file 0x0001, page 0x0000007C; in decimal this is page 124 of file 1, the only file for this tempdb), as well as the index root page (page 163), and the IAM page (page 125). There are several ways to locate the other data pages: following the chain of p_nextPage pointers in the data pages, following all pointers on the index root page, or inspecting the IAM page. I’ll skip the details of this process here; it’s rather boring. In my case, the data for sysidxstats was located on pages 124, 184, 167, and 164. The code in listing 2 then shows the contents of these pages. Note that I use dump style 1, which splits the data into individual rows but does not break out the columns as dump style 3 does. I was not interested in reading all details at this time, I just wanted to check whether extra rows were added at all.
DBCC TRACEON(3604);
DBCC PAGE (tempdb, 1, 124, 1);
DBCC PAGE (tempdb, 1, 184, 1);
DBCC PAGE (tempdb, 1, 167, 1);
DBCC PAGE (tempdb, 1, 164, 1);
Listing 2: Inspecting the pages
I restarted the instance, ran listing 2 (quickly checking that the allocations were the same as before I restarted the instance – after all, each restart makes SQL Server drop and recreate the tempdb database), froze my test query and then reran listing 2. I then meticulously compared the two results sets. When I was finally done, I had to conclude that there were absolutely no relevant differences.
For good measure, I then repeated the process for two other system views: sys.objects and sys.system_internals_allocation_units (and their underlying base system tables sysschobjs and sysallocunits), all with the same result. This proves that worktables used for spool operators are not only invisible in the “normal” system views for objects, indexes, and heaps; they are actually not even stored in the internal underlying base system tables. Apparently their location is tracked only within the memory allocated to executing the query.
While that is nice to know and an interesting discovery, it didn’t bring me any closer to my goal of finding and then investigating the structure of these worktables.
Found it!
Trying to find the worktable via system tables was a dead end. But I didn’t want to give up. Even though normal methods are, apparently, not used to track where worktable data is stored, SQL Server still needs to ensure that other processes don’t overwrite those locations for their temporary data. This is done via a few special pages: the PFS, GAM, and SGAM pages (page 1, 2 and 3 of the data file). My first attempt was to use the GAM page to see which pages changed status from “free” to “allocated”.
DBCC TRACEON(3604);
DBCC PAGE (tempdb, 1, 2, 3);
Listing 3: Inspecting the GAM page
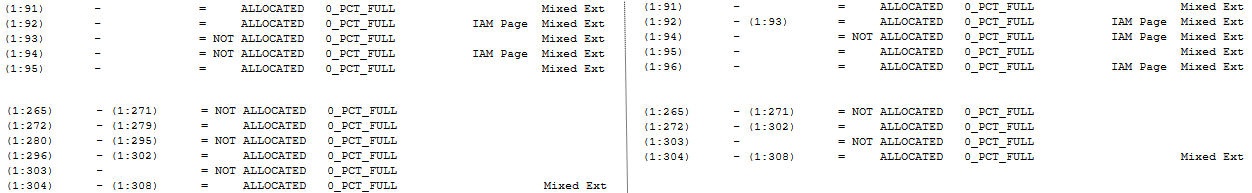
I select dump style 3 because that interprets the data for me (and I am lazy). I can now run this query before and after freezing a query that uses a spool. Figure 4 shows, side by side, the relevant part of the output before (left) and after (right) freezing the query.

As you see, this is not very fine grained. The GAM page tracks allocation per extent (block of 8 pages). So the line “(1:280) - (1:288) = NOT ALLOCATED” above shows that all 16 pages in the two extents starting at page 280 and at page 288 were free. To the right we see that these two extents are now allocated – all I can say for sure is that at least one page in the range 280 – 287 and at least one page in the range 288 – 295 was allocated when I froze the query.
Now I know that SQL Server usually fills extents completely, so it is far more likely that all of these 16 pages are now used. And they are very likely all allocated to the same object: the worktable created by the frozen query. The same goes for the other gaps that were free before I started and are now used, and for the extra pages allocated at the end (432 – 495). But there may also be pages allocated within segments that were already partly used, and those would not show in the GAM page.
My assumption (which, spoiler alert, turned out to be correct) was that a worktable is stored as a clustered index. That means that the majority of its pages are data pages. There are also root and intermediate pages, but only few in comparison to the rest. (For illustration, the screenshots above are from an experiment where the worktable stores almost 20,000 rows; it uses 119 data pages, a single root page, and no intermediate pages, so over 99% of the pages are data pages).
The data pages show signs that appear to confirm my suspicion, but I didn’t feel confident to declare that I was right before I had seen the root page as well. And that’s difficult. Each page stores several pointers to other pages, but only those that SQL Server needs. SQL Server needs to navigate horizontally at the same level. It needs to navigate from the top to the bottom. And it needs to navigate from the IAM page to all allocated pages. There are pointers for all of those situations. But there are no processes that need to navigate from a data page back up to intermediate or root pages or to the IAM, and hence no pointers to support such a process. I looked at all the (often mysteriously named) values in the page header, but none of them seemed to fit the bill.
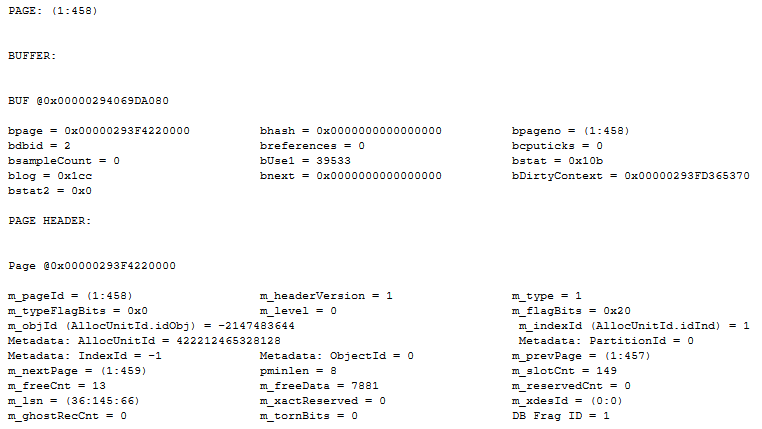
Yes, there is an object ID (m_objId), but it is negative and (as already suspected based on previous experiments) does not appear in sys.objects. Yes, there is an allocation unit ID (AllocUnitId) which even appears to be a “real” number, but (again not surprising) this number cannot be found in sys.allocation_units or sys.system_internals_allocation_units. Yes, there are pointers to the previous and next page (m_prevPage and m_nextPage), but they point to adjacent pages on the same horizontal level, never from a data page to a root or intermediate page. There are no pointers to the IAM page, nor to intermediate or root pages. So I can find one data page and follow all pointers, but still never see a root or intermediate index page. And with over 99% of the pages being data pages, the chance of just stumbling on an index page is small. Dead end?
This is where Twitter stepped in. I asked for help, and got lots of replies. One of them pointed me to this post, where Bob Ward not only describes how I can use m_objId in the page header to confirm that the page I was looking at was indeed allocated to a worktable (it was), but also discloses a system view that does actually track worktable information: sys.dm_os_buffer_descriptors. This DMV has a column allocation_unit_id, which matches the AllocUnitId value from the page header. Based on that information and some more experimenting I came up with the following query:
SELECT      *
FROM        sys.dm_os_buffer_descriptors
WHERE       database_id = DB_ID('tempdb')
AND         allocation_unit_id  = 422212465328128    -- AllocUnitId from DBCC PAGE
ORDER BY    page_type DESC, page_id;
Listing 4: Find all pages for the worktable, by allocation unit ID
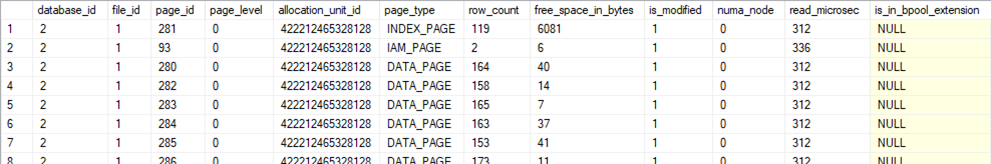
As you can see in the partial query results shown in figure 6, I now, finally, have an easy (for some values of easy – I still need to set up a proper frozen query, compare the before and after versions of the GAM page to find allocation changes, inspecting one such changed page to find the allocation unit ID, and then paste that value into this query) way to find the information I need.
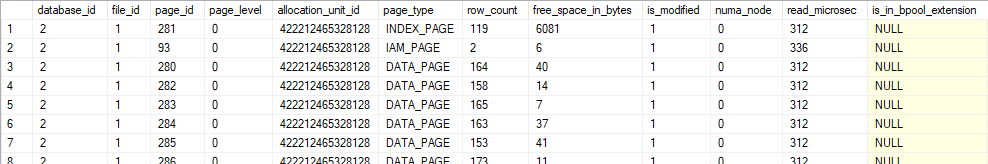
I now know where the IAM page of this worktable is located (though I don’t really need it anymore because all allocated pages are already listed below). I also know that there is a single index page (which therefore must be the root page) allocated to this worktable, plus 119 data pages; and I know the location of each of these pages. I already had a way to find the data pages (following next page and previous page pointers), but this method is more convenient. But more important: this was the first time I was actually able to locate, without doubt, all the pages of the worktable, including the root page and (if any) the intermediate pages. What I found on those pages is described below. I first want to focus on yet another problem I had to overcome when searching for worktables
Think of the little ones
The method described above works for large worktables. But I also had queries with worktables that took just a few rows, and I was not able to find them using the same method. That makes sense. When I look at the pages used for a large worktable, as described in the previous section, I don’t always find all of them through the GAM differences. A few may be allocated in mixed extents, which don’t show as a difference in the GAM page because the extent was already allocated (just not full yet) before I froze the query. But I can still find them using one of the other pages as a starting point. However, for a small worktable, it is possible that all pages are allocated from those mixed extents; in that case the GAM page shows no difference at all.
For this problem, the solution I found is to look at the PFS page (page 1 of the data file) instead. The PFS page also tracks page allocations, but at the page level (and with some convenient extra information to boot).
DBCC TRACEON(3604);
DBCC PAGE (tempdb, 1, 1, 3);
Listing 5: Inspecting the PFS page
The query in listing 5 is similar to the one in listing 3, but I changed the page number from 2 (GAM) to 1 (PFS). The interpreted (dump style 3) result of this query is a lot longer than the GAM output, so comparing the two results is more work. But it does result in a more complete insight into the pages used than I would ever get from the GAM query. Figure 7 shows some fragments from the output, with the original version on the left and the version after freezing a worktable on the right.
Compare the two and you will see that page 93 was unused at first, but is now an IAM page. That by itself is already enough: I can run DBCC PAGE with this number to find all pages allocated to this object. Or I can just use the AllocUnitId from the header of this page, or any other page I find in the differences (e.g. in the 280-295 range in case I do not find the IAM first) to find the AllocUnitId and then use that in the query presented in listing 4.
In this specific case I would then again get the results from figure 6, since these screenshots are all made from a single scenario. I eventually ended up always using this PFS-based method instead of my original GAM-based approach because this method is guaranteed to always have effect.
Table Spool
The first type of worktable I want to investigate is the one a standard Table Spool operator creates. I have long suspected that it uses a clustered index, let’s see if I can finally get that theory confirmed.
The queries
A simple way to get a Table Spool in an execution plan is to use TOP (...) PERCENT in a query. Without ORDER BY, the results are not deterministic; they may change between executions so it’s not possible to find a query that is guaranteed to block execution when I want to freeze the query. With an ORDER BY, the execution plan sometimes uses a Sort operator in which case the Table Spool is no longer needed. The only way to ensure that Table Spool rather than Sort is used is to use an ORDER BY with a column list that matches an index that covers the query.
CREATE TABLE dbo.Test1
    (BusinessEntityID int          NOT NULL PRIMARY KEY,
     FirstName        nvarchar(50) NOT NULL,
     LastName         nvarchar(50) NOT NULL);

BEGIN TRAN;
INSERT  dbo.Test1 (BusinessEntityID,
                   FirstName,
                   LastName)
VALUES (6421, 'Jonathan', 'Alexander');
--ROLLBACK TRAN;
Listing 6: Blocking query to freeze a Table Spool
INSERT  dbo.Test1 (BusinessEntityID,
                   FirstName,
                   LastName)
SELECT      TOP (1) PERCENT p.BusinessEntityID,
                            p.FirstName,
                            p.LastName
FROM        Person.Person AS p
ORDER BY    p.LastName;
Listing 7: Query that uses a Table Spool
In the AdventureWorks sample database, I use the query in listing 6 to create a lock that will freeze the query. I then run listing 7, which will freeze after creating a worktable.
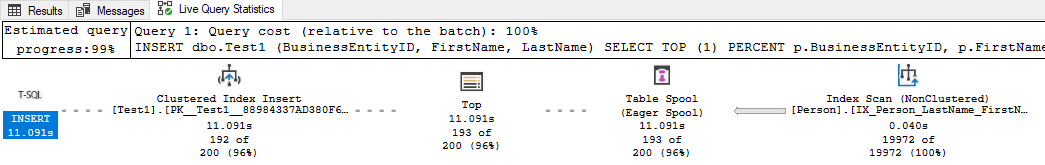
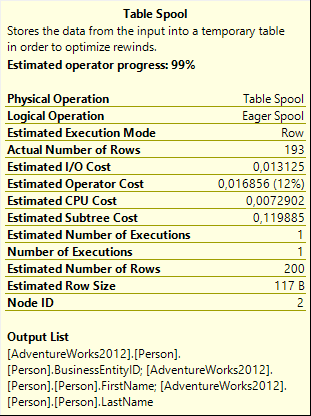
When running this with the Include Live Query Statistics option enabled, the result (shown in figure 8) shows that the spool has already built its worktable and populated it with 19,972 rows, but the operator has not been closed yet; the worktable remains allocated. The properties of the Table Spool operator (figure 9) show that the worktable stores three columns for each row: BusinessEntityID, FirstName, and LastName.
As you see, the Live Query Statistics option is a convenient way to confirm that the plan looks as expected, and that it blocks when the worktable is populated. But I don’t know if these Live Query Statistics cause any overhead in tempdb, so I restart the instance, switch off all execution plan and live query statistics options, and then repeat the test.
Using the methods described above, I find the Allocation Unit ID for the worktable, then run listing 4 to find the pages allocated to it. The result is shown in figure 10:
Data pages
Let’s first look at one of the data pages. I have looked at a few and the one on page 280 is probably the best to illustrate how the data is stored.
DBCC TRACEON(3604);
DBCC PAGE (tempdb, 1, 280, 1);
Listing 8: Inspecting a data page
If you have used DBCC PAGE before, you probably share my love for dump style 3. It does not only show the actual contents, but it also helps to interpret these contents. But in this case, dump style 3 failed me. That is because dump style 3 uses not only the data on the page itself, but also the metadata of the object that the page is for, to provide this interpretation. As I already found, no such metadata is stored for worktables – and that is why dump style 3 will not work for pages of a worktable. For data pages it simply shows no data at all (apart from the page header); for index pages it shows an error message.
Dump style 1, as used in listing 8, is the next best. It cannot extract the individual column values out of the page data, but it can still separate the individual records (because this can be done using only the data on the page itself). A fragment of the results is shown in figure 11.
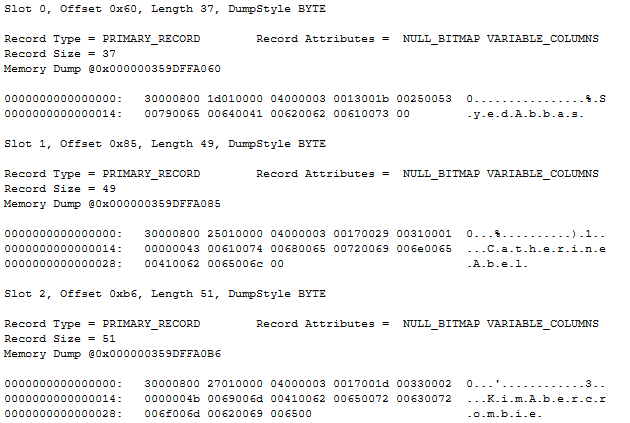
I am not going to describe each element in the representation of the records. There are other posts, linked to in the credits section, that you can read if you are interested in the nuts and bolts of how records are stored exactly. If you check those with the data shown in figure 11 (or the data on your own system if you follow along), you will see that the metadata of each record describes it as a data row with four columns, three of which are variable length and one is fixed length. We know from the operator properties in the execution plan that three columns are stored (BusinessEntityID, a fixed length integer; and FirstName and LastName, both variable length strings). So why is there a fourth column in the DBCC PAGE output?
In the first record (slot 0), it is easy to recognize the first and last name of Sayed Abbas, one of the rows in the Person.Person table. (In fact, the first when sorting by last name). We also, with a bit more effort, recognize their BusinessEntityID value: 285, or 0x011D (remember that SQL Server uses big endian notation, which swaps bytes). The mysterious extra column appears to be the first of the three variable length columns, ending at location 0x0013 in the record – which coincides with the start of the variable length data, so this column stores a zero length value in the first record.
In the next two records, I also see the names and BusinessEntityID values of rows from the Person table. The extra column in these records is a bit different: here the extra column still starts at byte 0x0013 but ends at 0x0017, so it stores a 4-byte value. That value is 1 (0x00000001) in the second record; 2 in the third record. Not visible in the screenshot is that this pattern continues, on this page and on all other data pages. All records except the very first of the (logically) first page store a 4-byte integer in this fourth column, starting at 1 and counting up by 1 for each record.
I have seen this pattern before, when investigating nonunique clustered indexes. It is the pattern of a uniqueifier, the hidden 4-byte integer that SQL Server adds to duplicate values in a nonunique clustered index, so that other indexes can still point to unique records. If you were to rebuild the Person table with a clustered index on LastName and then inspect a page where duplicate last names are stored, you will see that they have an extra column that is not in the table. The first occurrence of each last name has a zero-length value for that extra column; all others have a 4-byte integer starting at 1. For the next last name, the uniqueifier resets: again zero-length for the first one, and then 4 bytes counting up from one for duplicates.
Conclusion after looking at some of the data pages is that the worktable stores not only the three columns that one would expect, but also one extra column. This extra column seems to be a uniqueifier, which suggests a clustered index structure. The uniqueifier does not reset, as if all rows are duplicates.
Index pages
Before jumping to conclusions, I want to look at the index pages as well. Or rather, the index page: we have already seen that there is only one of them, probably the root page (assuming for now that the work table is indeed stored as a clustered index).
DBCC TRACEON(3604);
DBCC PAGE (tempdb, 1, 281, 1);
Listing 9: Inspecting the index page
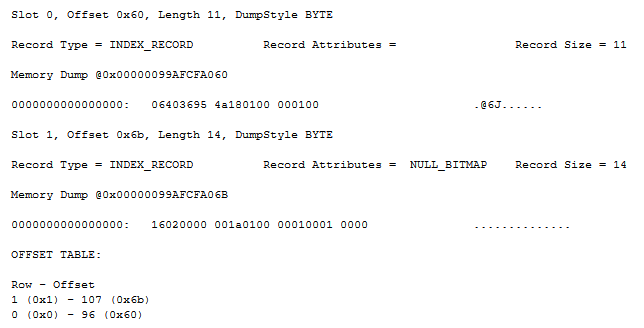
As mentioned before, my favorite dump style 3 doesn’t work on worktable pages. For the index page, it even throws an error message. So I again have to resort to dump style 1, and do the hard work of deciphering the contents of each record by hand. Here are the first few records as returned by the query above:
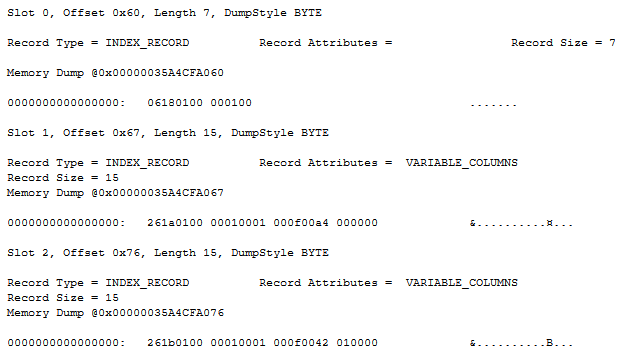
Let’s first look at the second record (slot 1). It stores a pointer to a page on the next lower level, in this case page 282 (0x0000011A) in file 1 (0x0001). As you can see in figure 10, this is one of the data pages of the worktable. The output of DBCC PAGE for this page (no screenshot included) shows that it stores uniqueifier values in the range from 164 up to 321. Slot 1 of the index page points to this page, and it stores a 4-byte integer field with the value 164 (0x000000A4) – exactly the uniqueifier value of the first row on page 282. Similarly, slot 2 shows that the first record on page 283 has a uniqueifier value of 322. This is the expected structure for a clustered index.
The first index row looks a bit different. It also has a pointer to a page (page 280 in this case, the one we looked at above). But here there is no additional value stored. As we saw before, the first row on page 280 actually has a zero-length uniqueifier value. The pointer to this page stores no value at all, it simply has one column less. I do not know why the “empty/missing” uniqueifier is stored in this inconsistent manner. However, it does not really matter: the first value on the root page is never used because there is never a need to check if the search target is before or after this value.
Conclusion
I investigated the pages that were allocated to a worktable for a Table Spool. I found that the data pages store not only the columns that the Table Spool needs (according to its properties), but also one additional column – a variable length column that appears to be a uniqueifier. It is zero length in the first record; in all other records it uses 4 bytes and stores an integer value counting up from 1.
For a normal clustered index, the index pages store pointers to these data pages along with the index values of the first row on each data page. The worktable has just one index page and it does indeed store page pointers, using the uniqueifier as the only indexed column.
This shows that a worktable for a Table Spool is stored internally as a clustered index. The structure of the index is the same as for any clustered index, but the definition is unusual because there are no indexed columns. Because zero columns are, by definition, not unique, a uniqueifier is added – just as with any clustered index on a non-unique column or column combination.
Index Spool
As mentioned at the start of this article, Index Spool is the only spool operator for which at least something is documented. On this page, the description of Index Spool says that it places “a copy of each row in a hidden spool file (stored in the tempdb database and existing only for the lifetime of the query), and builds a nonclustered index on the rows”.
A nonclustered index stores only the values in the indexed columns and a pointer to the rest of the data, stored in either a clustered index or a heap, so it cannot exist by itself. Based on the description above I expect an Index Spool to create two objects: the nonclustered index mentioned in the description, and the clustered index or heap that stores all of the data.
But I’m not taking anything for granted. Let’s check!
The queries
In order to get an Index Spool, I use a query that joins to an aggregation subquery, in a pattern where the optimizer wants to do the aggregation once, and then store and index the results to optimize the join performance. Listing 10 shows the query I use for this. The execution plan has a shape that I discussed in detail in a blog post, so you can go there if you want to understand what this works exactly.
INSERT  dbo.Test1 (ProdName,
                   Subcat,
                   ListPrice,
                   MinPrice,
                   MaxPrice)
SELECT      p.Name,
            p.ProductSubcategoryID,
            p.ListPrice,
            ps.MinPrice,
            ps.MaxPrice
FROM        Production.Product                                        AS p
CROSS APPLY (SELECT MIN(p1.ListPrice) AS MinPrice,
                    MAX(p1.ListPrice) AS MaxPrice
             FROM   Production.Product AS p1
             WHERE  p1.ProductSubcategoryID = p.ProductSubcategoryID) AS ps;
Listing 10: Query that uses an Index Spool
CREATE TABLE dbo.Test1
    (ProdName  nvarchar(50) NOT NULL PRIMARY KEY,
     Subcat    int          NULL,
     ListPrice money        NULL,
     MinPrice  money        NULL,
     MaxPrice  money        NULL);

BEGIN TRAN;
INSERT  dbo.Test1 (ProdName,
                   Subcat,
                   ListPrice,
                   MinPrice,
                   MaxPrice)
VALUES (N'All-Purpose Bike Stand', 0, 0.00, 0.00, 0.00);
--ROLLBACK TRAN;
Listing 11: Blocking query to freeze an Index Spool
Running first listing 11 to force the freeze and the listing 10 with Include Live Query Statistics turned on results on the execution plan shown in figure 13:

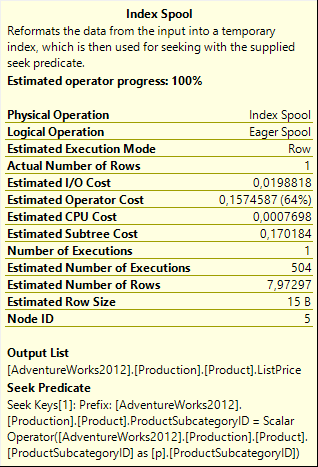
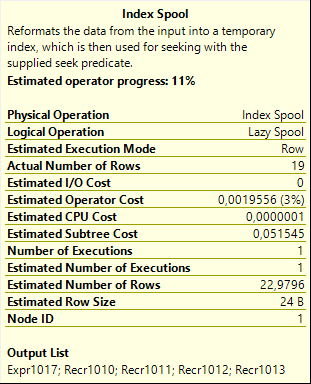
Before looking at the actual data and index pages created by the Index Spool, I check the properties of this operator. An Index Spool obviously has to store the columns it returns, but also all indexed columns even when they are not returned. The returned columns are shown, just as for the Table Spool, in the Output List property. The indexed columns are not exposed explicitly but can be derived by looking at the Seek Predicate property. The benefit of an Index Spool over a Table Spool is that it can efficiently return a subset of the data it stores, because of the index it builds. The Seek Predicate determines what subset to return, so it is obvious that the index has to support this Seek Predicate.
In this case, the Output List shows just a single column, ListPrice. The Seek Predicate shows that the Index Spool filters data on ProductSubcategoryID. So I expect the worktable to store these two columns, and the nonclustered index on it to store ProductSubcategoryID as the indexed column along with a reference to the row in the clustered index or heap.
The spool runs as an “Eager Spool”, so by the time the query is frozen it has already processed all its 502 input rows and stored them in the worktable. With less rows and less (and smaller) columns than the Table Spool I investigated earlier, the objects created will be fairly small. But they should still be large enough that I can inspect the allocated pages to describe their structure.
Finding the objects
As before, I restart the index, freeze the query (without execution plan or live query statistics), and compare the contents of the PFS page before and after freezing to find the objects allocated to the running query. I expect to find two new objects, each with their own IAM page and their own data (and possibly index) pages: one for the spool itself and one for the nonclustered index that the documentation promises.
Much to my surprise, I found just a single new object. I checked, double checked and triple checked my findings. I cross checked by using the SGAM method instead of the PFS method. But no matter how often I retried, and how long I looked, just four pages get allocated when I freeze this Index Spool, all recording the same Allocation Unit in their page header. I entered this number in the query of listing 4 to see the exact pages used:

Though I was surprised to see just a single object, and had no idea at that time how to explain that, I did have the tools to dig deeper. The page locations are already known; all I have to do is use DBCC PAGE to check their contents. Perhaps then I will understand why there is no second object.
Data pages
As with the Table Spool, I will start with one of the data pages. And as with the Table Spool, I can’t use dump style 3. Figure 16 shows a fragment of the DBCC PAGE output for page 282, using dump style 1:
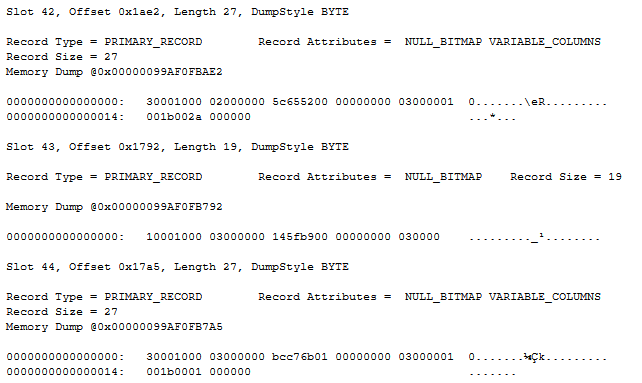
Looking at the data for slot 42, I see that the record stores three columns. Two are fixed length, with values 2 (0x00000002, probably the ProductSubcategoryID), and 5399900 (0x000000000052655C, the internal representation for the value 539.99 stored as data type money, which is indeed the ListPrice for at least one of the products with ProductSubcategoryID 2). The unexpected third columns is variable length and stores 42 (0x0000002A).
Slot 43 has only the two fixed length columns, and the values stored are 3 and 1214.85. Slot 44 is back to three columns; the fixed length columns store values 3 and 2384.07; the variable length column has the value 1.
These records, as well as the rest of the records on the page, consistently store either two or three values. The two values that are always there correspond to a SubCategoryID value and a ListPrice. The third is absent for the first row of any SubCategoryID and is a 4-byte integer counting up from 1 for subsequent rows of the same SubCategoryID. This must be, once more, a uniqueifier column.
I decided not to include a screenshot for page 280, because this one is a bit harder to read than the other pages. That’s because this page is mostly filled with records for ProductSubcategoryID NULL; most of them with ListPrice 0.00. Due to how these values are stored, decoding these values from the dump style 1 output is even harder than for “regular” values. If you follow along, feel free to inspect the first page allocated to the worktable on your instance, and you will find that the data on all pages has this same structure.
Index pages
Again using dump style 1, it is now time to look at the index page for this worktable:
I was able to include the entire DBCC PAGE output (except the page header) in the screenshot above, because there are only two slots used on this page. Which makes sense. There are just two data pages, and the index pages hold pointers to each of the data pages, so there can’t be more than two slots here.
Let’s first look at the second record (slot 1). It stores a pointer to the second data page (page 282, or 0x0000011A, of file 1), and a fixed length 4-byte integer with the value 2. This matches with the first record found on page 282. The first record on page 282 is for ProductSubcategoryID 2 and has the zero-length uniqueifier, so this matches with my expectation.
I don’t know if it’s coincidence or a result of how the page split algorithm works, but I consistently see all rows for ProductSubcategoryID NULL and 1 go to the first page, and all remaining rows to the second page. I have done some experiments with other data as well; it is possible for a page to start with a record that does have a uniqueifier value, in which case the corresponding row in the index root page will also store that value. This is normal for a nonunique clustered index in SQL Server.
The record in slot 0 is similar to the one in slot 1, except that here the null bitmap is omitted. Which is funny, because this one actually points to a page that has a null value in its first slot. But as explained in the discussion of the index structure for the worktable of a Table Spool, the first value of the root page is never used anyway, so I guess that Microsoft decided to save a few bytes by not including a null bitmap in this record. The fixed length part of the record does still exist and it shows a weird value: 0x4A953640. I do not see any logic to this number but I guess that this simply stores what happened to already be stored in that memory location.
The page reference stored in slot 0 is, as expected, a pointer to page 280 in file 1.
Conclusion
Microsoft provides very little documentation on how spools work and how they store their data. It is sad to see that what little documentation they do provide is wrong.
Despite what the documentation says, an Index Spool does not create a nonclustered index! The data in the spool is stored, just as for a Table Spool, as a clustered index. Where a normal Table Spool builds this index on zero columns (thereby effectively using the uniqueifier as the only unique value in the rows), an Index Spool instead creates its clustered index on actual columns – the columns in needs to extract relevant subsets of data as specified in the Seek Predicate property.
A lot of people sometimes refer to Index Spool as “Nonclustered Index Spool”. Based on Microsoft’s documentation, that makes sense. But based on my findings of the actual storage structure used by an Index Spool, we should all stop using this misleading term.
Stack Spool
The last type of spool I want to investigate is a stack spool. In case you wonder: “did I ever see this operator in an execution plan” – you didn’t. A stack spool is a special kind of spool, but it shows in execution plans as an Index Spool or Table Spool. You need to inspect the properties: if it has the With Stack property then the spool is actually a stack spool.
The name “stack spool” is a reference to the “stack” storage structure, a collection of data where the element that was added last is read and removed first. Its name is a reference to the concept of a stack of plates in a self-service restaurant – the plate a customer grabs will always be the one the cleaning crew added to it last.
The queries
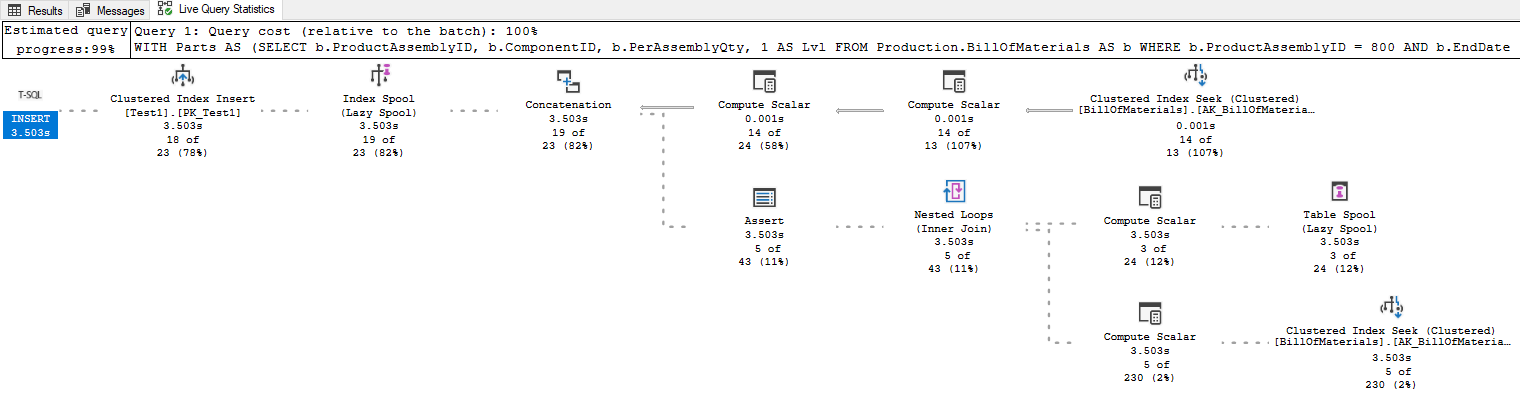
Stack spools are typically used for recursive CTEs, so that’s what I used here (listing 12). A detailed explanation of the execution plan this query generates is planned for a future blog post.
WITH Parts
  AS (SELECT      b.ProductAssemblyID, b.ComponentID, b.PerAssemblyQty, 1 AS Lvl
      FROM        Production.BillOfMaterials AS b
      WHERE       b.ProductAssemblyID = 800
      AND         b.EndDate IS NULL
      UNION ALL
      SELECT      b.ProductAssemblyID, b.ComponentID, b.PerAssemblyQty, p.Lvl + 1
      FROM        Production.BillOfMaterials AS b
      INNER JOIN  Parts                      AS p
            ON    b.ProductAssemblyID = p.ComponentID
            AND   b.EndDate IS NULL)
INSERT  dbo.Test1 (ProductAssemblyID, ComponentID, PerAssemblyQty, Lvl)
SELECT  Parts.ProductAssemblyID, Parts.ComponentID, Parts.PerAssemblyQty, Parts.Lvl
FROM    Parts;
Listing 12: Query that uses a stack spool
I again use the standard pattern of adding a row to the destination table and leaving the transaction open to block execution of listing 12 and freeze the execution plan. Listing 13 shows the values used to make the query freeze at just the right moment.
CREATE TABLE dbo.Test1
    (ProductAssemblyID int           NOT NULL,
     ComponentID       int           NOT NULL,
     PerAssemblyQty    decimal(8, 2) NOT NULL,
     Lvl               int           NOT NULL,
     CONSTRAINT PK_Test1
         PRIMARY KEY (
         ProductAssemblyID,
         ComponentID));

BEGIN TRAN;
INSERT  dbo.Test1 (ProductAssemblyID,
                   ComponentID,
                   PerAssemblyQty,
                   Lvl)
VALUES (3, 504, 0.00, 0);
--ROLLBACK TRAN;
Listing 13: Blocking query to freeze a stack spool
If you commit the transaction in listing 13 to allow the listing 12 to finish, it aborts with a primary key violation. But that error occurs “after” the freeze so it won’t affect me. In frozen state, the live query statistics (figure 18) show exactly how far the query was able to progress before being frozen.
As explained by Craig Freedman, a stack spool has two elements. One adds rows to the worktable, just like any other spool. The other reads rows from that same worktable, and deletes them. This last part, deleting rows from the spool, is the unique behavior that makes stack spools special. And one of the things I want to find out is whether they are actually physically deleted from the worktable, or whether they remain there but are marked as processed (making it a logical deletion).
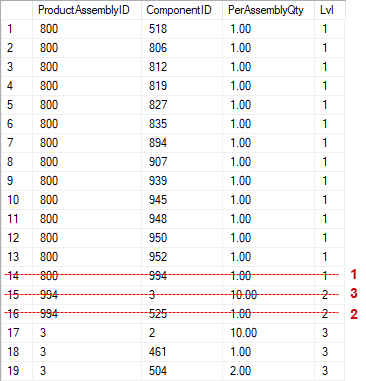
The row counters in the live query statistics not only show that the spool is frozen, but also at exactly what moment. The Index Spool to the left, which adds rows to the worktable, has processed 19 rows. I can run the query without the INSERT line to see the results in the order they are produced (obviously after checking that this doesn’t change the execution plan, apart from the added Clustered Index Insert operator). The first 19 rows of the results must be the rows that were added to the worktable before the query is frozen. These are shown in figure 19.
The Table Spool to the right, that reads rows from the worktable and then deletes them, has processed 3 rows. Based on Craigs explanation, these should be the last added rows at the time at the time a row is read. I can walk through the execution in order to see which rows these are: the strikethrough shows which rows are processed and deleted; the numbers represent the order in which that happened. (Processing row 14 produces rows 15 and 16; processing row 16 produces no new rows; and processing row 15 produces rows 17, 18, and 19 where the query is frozen.)
Figuring out what data the spool stores is not obvious. Because of the Concatenation operator, all columns have been renamed. It takes a bit of effort to decipher the Output List of the Index Spool and Table Spool operators. The first column (Expr1015) turns out to be an internal (zero-based) counter to track the recursion level. The remaining four columns correspond to the four columns returned by the query: ProductAssemblyID, ComponentID, PerAssemblyQty, and Lvl.
Although the spool is represented as an Index Spool, there is no Seek Predicate property. So as far as I can tell, no extra columns are needed in the worktable to help the operator return a proper subset of rows. However, it is possible that the With Stack property (not visible in the property pop-up window; you need to check the full properties list to see this) causes some additional data to be added to the worktable; I will keep that in mind while investigating the data and index pages.
Data pages
In order to find out how the data for this spool is stored, I once more use the PFS method to find the pages that are allocated when this query is frozen. It turns out (not surprisingly, given the low number of rows and small data sizes of the columns) that apart from the IAM page just one extra page is needed.

The data is stored on page 280, which is classified as a data page. That doesn’t reveal anything about the structure of the worktable yet: all table structures use just a single data page as long as all data fits on that single page. I’ll later run another test to check whether index pages are added when more data is stored. But let’s first examine this example.
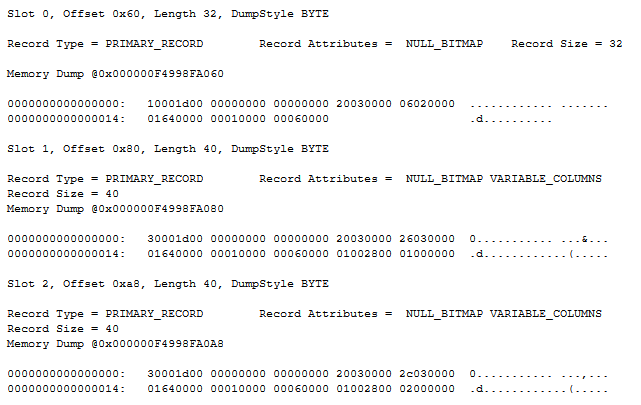
The screenshot above shows the first three records from page 280, again using dump style 1. Let’s see if we can decipher this data. It helps that I know what to expect in the first row: the internal nesting counter (0, apparently stored in 8 bytes though I seriously hope that nobody will ever run a query that would need it to be this big!), ProductAssemblyID (800, or 0x00000320), ComponentID (518, or 0x00000206), PerAssemblyQty (1.00, stored in five bytes – four for the value: 0x00000064 for 100; and one for the sign: 0x01 for positive), and Lvl (1). The last bytes of the record show that there are 6 columns, even though a sixth column is nowhere to be found in this record (this will become clear as I move to the next record), and none are NULL.
For the second and third record, I see the same organization of the data, and values matching with what I see in the second and third row in the output. These two slots also have an additional variable length part where that ominous sixth column is stored in 4 bytes and with values 1 and 2. This looks to be yet another uniqueifier.
For a better understanding of this data, we also need to look at the last rows in the worktable, as shown in figure 23:
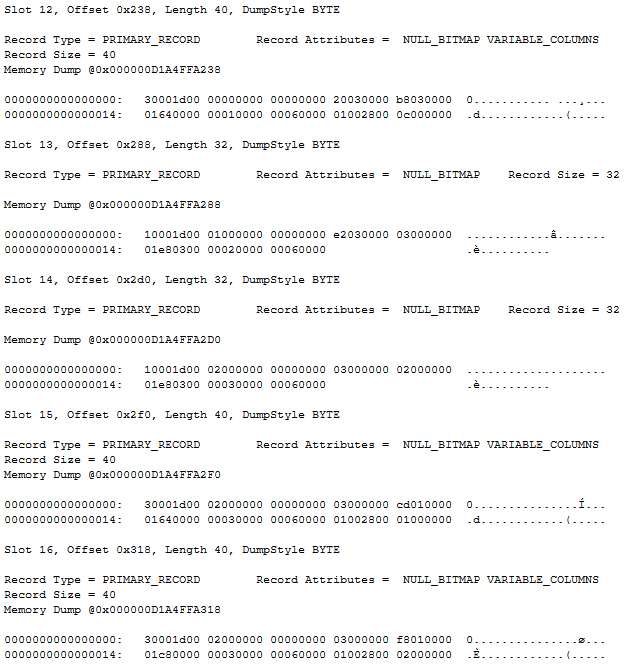
The data in figure 23 shows the last six rows in the worktable, stored on slots 12 – 16 (rows 13 – 17 because the slot counter starts at zero) on the page. In slot 12 I see the 13th row: ProductAssemblyID 800 (0x00000320) and ComponentID 952 (0x000003b8). The last row for ProductAssemblyID 800 (the 14th row in figure 19) is nowhere to be seen on the page; this confirms that this row is indeed physically deleted and not just marked as processed (logically deleted).
Slot 13 shows first record where the internal nesting counter is 1. The other values are 994 for ProductAssemblyID, 3 for ComponentID, 10.00 for PerAssemblyQty, 2 for Lvl, and no data in the uniqueifier column. This corresponds to row 15 from figure 3. This row was already read; based on the blog post from Craig Freedman and the observation that rows 13 and 14 are actually deleted from the worktable, I had expected this row to be removed as well. This poses a mystery that I will look into a bit further below. But let’s first check the remaining rows.
The last records in figure 23 (slots 14, 15, 16) hold no surprises. These represent rows 17 – 19 from figure 19: all of them have the internal nesting counter at 2, with uniqueifier values (absent), 1, and 2. All have ProductAssemblyID 3, and the expected data (see figure 19) in the other columns.
Preliminary conclusion
The worktable of a stack spool stores only the columns that are listed in the Output List property, plus a uniqueifier that resets whenever the recursion level resets. This suggests that the worktable is structured as a clustered index on a single column: the recursion level. I have yet to confirm this by looking at an example that uses more than one page to verify that index pages are then added.
Rows that are processed are actually physically deleted, not just marked as processed (logically deleted). However, though three rows should have been deleted only two actually were. I’ll look into the reason for this apparent discrepancy below.
Further testing
In order to investigate the structure of a stack spool in even more detail, I needed a somewhat more complex test case. Listing 14 creates and fills the required tables.
CREATE TABLE dbo.Hierarchy
    (ID     int NOT NULL IDENTITY PRIMARY KEY,
     Num    int NOT NULL,
     Parent int NULL
         REFERENCES dbo.Hierarchy (ID));
CREATE TABLE dbo.NumToTxt
    (Num int        NOT NULL PRIMARY KEY,
     Txt varchar(5) NOT NULL);
CREATE TABLE dbo.Test1
    (ID      int        NOT NULL PRIMARY KEY,
     HierStr char(4000) NOT NULL);

INSERT  dbo.NumToTxt (Num, Txt)
VALUES (0, 'zero'),
       (1, 'one'),
       (2, 'two'),
       (3, 'three'),
       (4, 'four'),
       (5, 'five'),
       (6, 'six'),
       (7, 'seven'),
       (8, 'eight'),
       (9, 'nine');
INSERT  dbo.Hierarchy (Num, Parent)
VALUES (1, NULL),
       (2, NULL),
       (1, 2),
       (2, 2),
       (1, 4),
       (3, NULL),
       (4, NULL);
Listing 14: Create and fill some demo tables
Based on these input tables, I now write the hierarchical query shown in listing 15. Please don’t bother trying to read any logic in the query, there is none. This query was designed for just a single purpose of allowing me to freeze and unfreeze the execution plan at will so that I can investigate the worktable in various stages of its execution.
I also added a CAST to char(4000) in the query to inflate the size of rows in the worktable; since the worktable stores more than two rows this helped me achieve my other target of inspecting an index page to verify that the worktable in indeed structured as a clustered index.
WITH MyCTE
  AS (SELECT        h.ID,
                    h.Parent,
                    CAST(t.Txt AS char(4000)) AS HierStr
      FROM          dbo.Hierarchy AS h
      INNER JOIN    dbo.NumToTxt  AS t
         ON         t.Num = h.Num
      WHERE         h.Parent IS NULL
      UNION ALL
      SELECT        n.ID,
                    n.Parent,
                    CAST(TRIM(b.HierStr) + ' dot ' + t.Txt AS char(4000))
      FROM          MyCTE         AS b
      INNER JOIN    dbo.Hierarchy AS n
         ON         n.Parent = b.ID
      INNER JOIN    dbo.NumToTxt  AS t
         ON         t.Num    = n.Num)
INSERT INTO dbo.Test1 (ID,
                       HierStr)
SELECT  MyCTE.ID,
        MyCTE.HierStr
FROM    MyCTE;
Listing 15: Another query with a stack spool
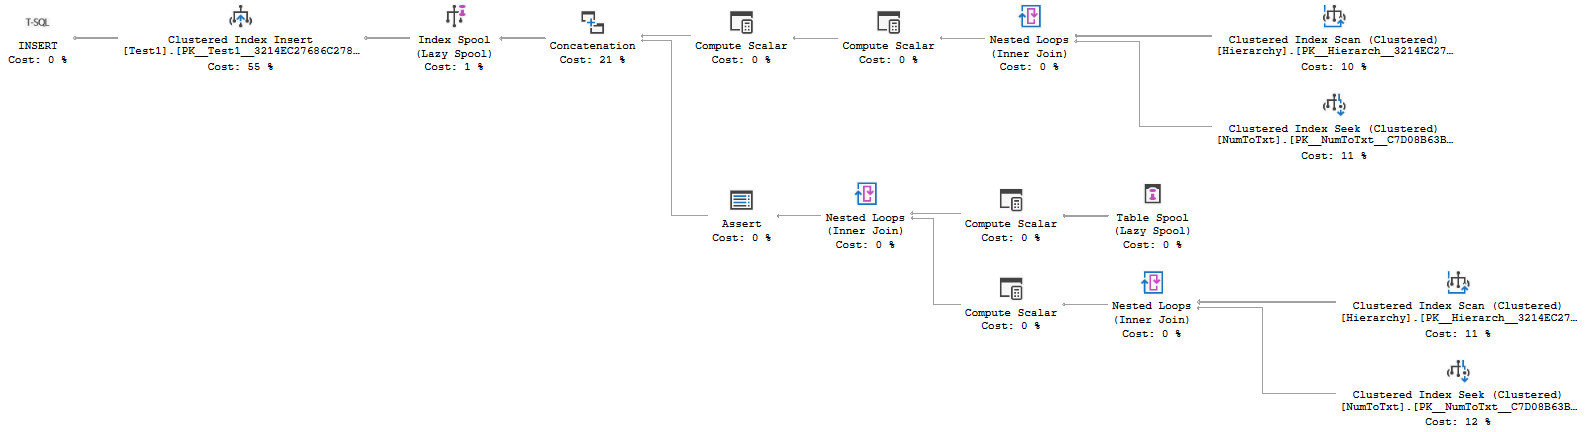
Let’s check out the execution plan of this query to verify that it does indeed use a stack spool. The graphical execution plan is shown in figure 24. The properties of the Index Spool (top left) and Table Spool (bottom right) confirm that this is indeed a stack spool.
This query and its execution plan are more complex than the others in this article, but that does give me a lot more control over when and where to freeze the query. Just as in the previous examples, I can freeze the query at the Clustered Index Insert operator by ensuring that the Test1 table is locked by another row, as shown in listing 16:
-- To be run in multiple windows, with multiple values
BEGIN TRAN;
INSERT  dbo.Test1 (ID, HierStr)
VALUES (1, 'Dummy'); -- Change to 2, 3, etc
--ROLLBACK TRAN;
Listing 16: Query to block the clustered index insert
This by itself is still the method I used before. New is that I now run two copies of this query, in separate windows. That allows me to make the query progress one row at a time, as long as I know in which order rows will be added to the table. If you run listing 15 without the INSERT INTO lines, you can see that order in which ID values are returned: 1, 2, 6, 7, 3, 4, 5. If I start with two copies of listing 16 to block values 1 and 2, then listing 15 freezes as the first row is added to the worktable. I can then inspect the pages allocated to the worktable in tempdb; once done I can roll back the transaction that blocks ID value 1 and now listing 15 will continue – but be immediately blocked again as it tries to insert the next row. I can then (if I want to) first create a new block for the next place where I want to freeze and then repeat this as often as I want to.
-- To be run in multiple windows, with multiple values
BEGIN TRAN;
SELECT  ntt.Num,
        ntt.Txt
FROM    dbo.NumToTxt AS ntt WITH (XLOCK)
WHERE   ntt.Num = 1; -- Change to 2, 3, etc
--ROLLBACK TRAN;
Listing 17: Query to block the Clustered Index Seek
But I didn’t stop there. Listing 17 shows another query, that I also run multiple copies of. This query forces an exclusive lock on the NumToTxt table. Both the anchor and the recursive part of the execution plan use a Nested Loops into a Clustered Index Seek on NumToTxt to implement the join in the query. Listing 17 blocks any seek for only the value used, freezing the execution plan in a different location. Knowing the order of the Num values processed (1, 2, 3, 4, 1, 2, 1), I can again control exactly how many iterations to process before the next freeze before releasing the currently blocking lock.
Test results
Using the above described technique to take various locks from multiple windows that I can then release and re-take one at a time, I can almost single-step through the execution plan of figure 24. As in the previous sections, I first ran the query without INSERT INTO to ensure I know the order in which data is processed in all parts, then ran it with INSERT INTO to ensure that the execution plan remains the same, and finally executed it with Live Query Statistics to double check that each step of my test script freezes the query where I want it to be frozen. I then restarted the instance and stepped through my test script, investigating how the data in the worktable changes over time as the query executes and rows are added to and removed from the worktable.
I will not include screenshots of all the pages I inspected. Based on the examples shown already in this article, you should be able to follow along if you want to verify my findings. But by looking at the pages in all stages of the process, I was able to deduct the following information about the internal processing of a stack spool as related to the worktable:
- The worktable data structure is not allocated when the operator initializes. This is postponed until the Index Spool actually stores a first row. This means that if an execution plan happens to find no rows to pass through the stack spool operator, the worktable will not even be allocated.
I assume that this applies to all spool operators but it’s only verified for this stack spool. - The worktable is definitely a clustered index. When it holds more data than fits on a single page, I see the normal structure of data pages plus at least one index page. The index key is the nesting level (which SQL Server always computes in the logic for any recursive CTE), stored as an 8-byte integer (bigint). A uniqueifier is added to the pages because the nesting level by itself doesn’t guarantee uniqueness.
- The Table Spool that reads the data always returns the row that was the most recently added to the worktable. This last row added always has the highest combination of nesting level + uniqueifier of all rows in the worktable, so based on how the worktable is built I assume this is implemented by using the clustered index structure to immediately navigate to the logically last value (similar to how a Clustered Index Scan with properties ordered backwards finds its starting point).
- Rows stored in the worktable are not deleted when they are read, but after processing of the row is complete. The Table Spool operator that reads from the worktable always first deletes the row it read the last time it was called, before reading the next row. This means that a row that has been read and is currently being processed by other operators is not yet deleted, but still exists in the worktable.
This row is not marked in any way, and by the time the next row has to be read and this row has to be removed there may have been new rows added. So the operator can’t simply delete the last row before reading a row; instead it probably memorizes the values of its key columns in operator memory. On the next call, it first finds the row to delete (using the index structure), then reads the next row to process (the most recently added row, the last row of the last page in the index structure).
I don’t know why the operator doesn’t simply read a row and then immediately delete it before returning control. That appears to be a simpler implementation. My guess is that Microsoft identified situations where the same row will be read from the worktable multiple times – which of course is not possible if it’s already deleted. However, I have so far not been able to construct a query where this actually happened. - Since news rows are always added at the end, they’ll be “behind” the row that has to be deleted. This makes the worktable inefficient at reusing space. In my tests there were moments where I had an entire page that was empty (technically, the last deleted record was still there, marked as ghost record). This page was only reused once all rows “behind” it were read and deleted without any new data being added. I do not know if there is also a process that releases such empty pages after reaching a certain threshold; if not then a stack spool has the potential to end up using quite large chunks of tempdb.
Conclusion
Where other spool types suffer from a lack of documentation on how they structure the data in the worktable, stack spool suffer from an even greater lack of documentation: they are never mentioned in Books Online at all!
They do exist though. Always in pairs, of one Index Spool to add rows to a worktable, and a Table Spool to read and delete those rows. Both these operators have a With Stack property that is set to True.
Plans that use a stack spool always also have operators to compute a nesting level. This nesting level is stored within the worktable for the stack spool, along with the columns needed for the actual query. The worktable is then organized as a clustered index, using the nesting level as the key column, plus the internal uniqueifier because the nesting level is not a unique key.
The Table Spool operator always reads and returns the row that was most recently added to the worktable, which is always the row with the highest nesting level / uniqueifier value. The row it reads is not immediately deleted. The Table Spool retains, in its operator memory, the key values of the last read row, and deletes that row upon the next call, just before reading the next row.