Some time ago a reader reached out to me with a request for help. He showed me a query and accompanying execution plan, and asked if I could help reduce (or, better yet, eliminate) the many hash spills that were killing his performance.
While helping him work through the plan, I was once more reminded of one of my pet peeves with execution plans: we get to see the requested memory for the plan (the Memory Grant and MemoryGrantInfo properties), which is of course based on the estimated total memory usage of operators that are active at the same time. We also get to see the actual memory used by each individual operator (in the Memory Usage property). But there is no way to see how much memory the optimizer estimates for each individual operator.
That makes troubleshooting all kinds of memory grant issues harder than it should be. And Microsoft could probably help us quite easily. The optimizer computes the estimated memory for each operator anyway. Why not expose that in the execution plan?
So I made a suggestion to Microsoft to do exactly that. Go here and vote for it if you support the idea.
Can Memory Fractions be an alternative?
At this time there is no way to directly see in an execution plan how much memory each operator contributes to the Memory Grant. If you know how each operator works, then you can do it indirectly. For instance, when a Hash Match operator performs an Inner Join, then it wants to store the entire build input (the upper input in the graphical execution plan) in an in-memory hash table. So you can look at the Estimated Number of Rows and Estimated Row Size properties of the top input (or even look directly at the Estimated Data Size that SSMS pre-computes for you if you hover the arrow) to get an idea of how much data SQL Server estimates to be stored.
But that is a rather roundabout way and requires that you know for each memory-using operator what exactly it wants to store in memory. It would be so much easier if we could just get this directly from the properties of each operator. So at this point I was tempted to see if, perhaps, the Memory Fractions property could be used to reconstruct the required memory for each operator.
The brief answer is: No.
Sadly, the Memory Fractions is not a good source for this information. But to understand why, a much longer explanation is needed.
Share memory or reuse memory?
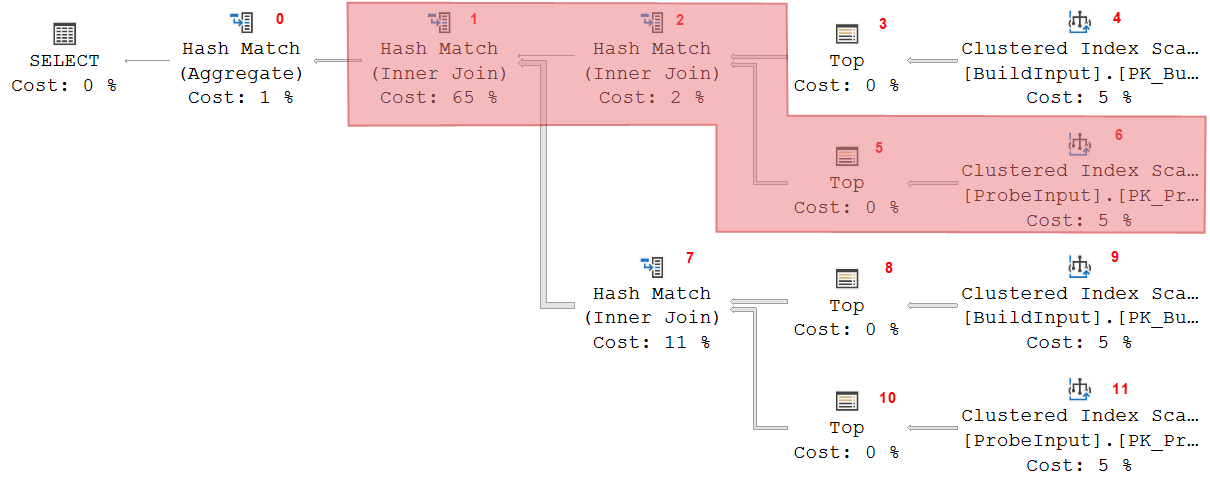
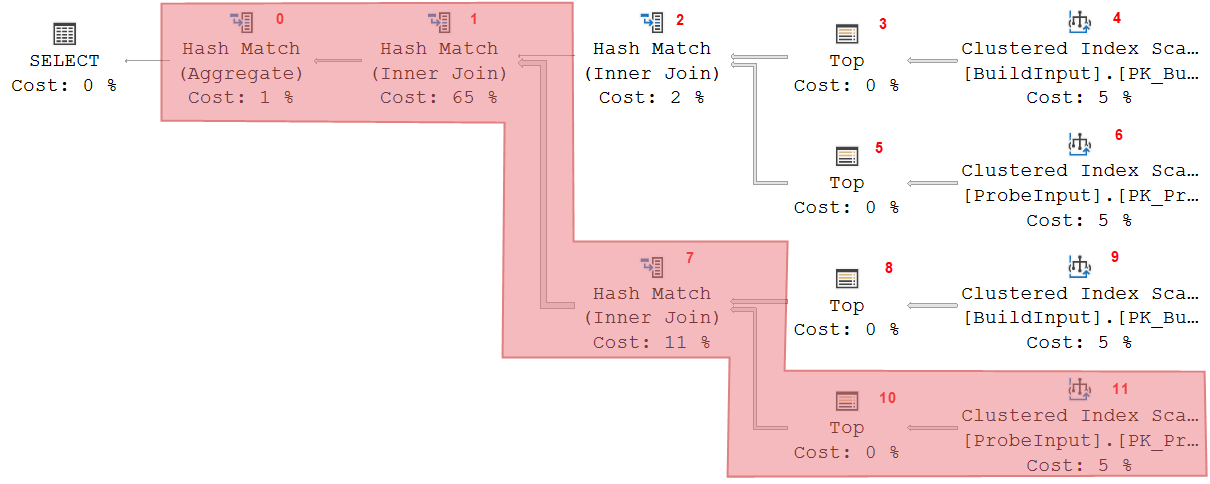
Let’s look at a moderately complex sample execution plan.
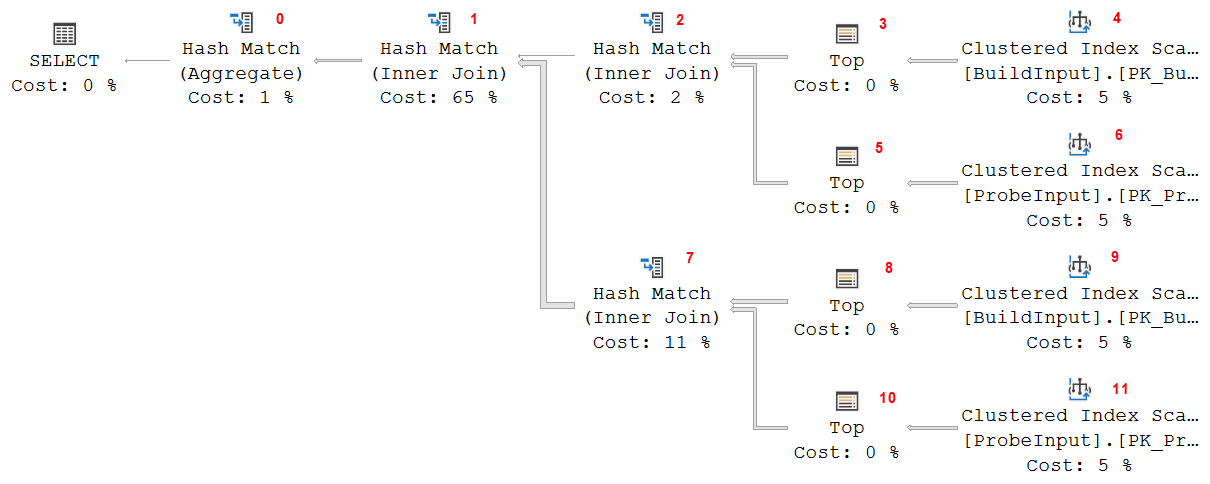
The actual query used to create this execution plan is not really relevant for this post. I will attach a script that you can use to reproduce this execution plan, just in case you really want to, but it’s not needed. Also, the plan above is for SQL Server 2017. You might see minor differences on other versions, but nothing that really impacts the rest of the explanation.
I added small red numbers in the picture above. These are the values of the Node ID property of each operator. I will use these numbers to refer to a specific operator in the rest of the explanation.
To understand how this execution plan runs, and how memory is managed during that time, we’ll have to go through it in detail. For the explanation below I will assume that you are already aware of the phases of the Hash Match operator. If not, you can click here to find that information.
First stage
The start of the execution is fairly standard. The GetNext() call on Hash Match 0 starts its build phase; it then calls GetNext() on Hash Match 1, which also starts its build phase; and then the same happens for Hash Match 2. This operator then calls its own build input (Top 3 and Clustered Index Scan 4). Those operators read a row and return it to Hash Match 2, which stores it in the in-memory hash table and then requests the next row from this same build input.
So at this time, operators 0 and 1 have started, but have not received any data yet. So they also don’t story any data yet. Operator 2 is receiving and storing rows, produced by operators 3 and 4. The rest of the execution plan is not yet active. As rows are processed, operator 2 will gradually increase its memory usage, until it is done processing its build input. At this time (assuming there are no spills), its entire build input is in memory.
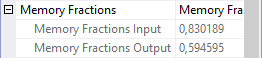
If you look at the Memory Fractions property of operator 2, and then specifically the Memory Fractions Input subproperty, you can see that it is set to 1, which represents 100%. During the time this operator processes its (build) input, it is the only operator actively using memory, so it can use 100% of the memory that is needed for this stage.
But … the memory needed for this stage is not necessarily the memory needed for the entire query execution. Don’t make the mistake to think that, because there is a 1 here, the full 100% of the Memory Grant is caused by this operator. We need to check the rest of the execution first.
Second stage
Hash Match 2 now closes its build input. The data in memory must remain there for now, because it opens its probe input and matches data received there (from operators 5 and 6, that do not use memory) to the data stored in the hash table. It returns matching rows to operator 1, also a Hash Match, but this one is still in its build phase.
The memory usage of operator 2 is constant in this stage. It cannot remove even a single row from its hash table. But operator 1 now needs to store the data is receives, building a second hash table. So the total required memory for this stage is higher than it was for the first stage. The two now active memory-using operators have to share the available memory.
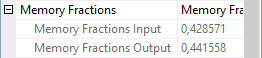
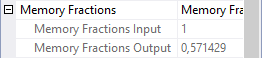
This is where the Memory Fractions properties get interesting. Operator 2 is now in its output stage, so we can look at the Memory Fractions Output property; the screenshot above shows that this is 0.571429 (57.1429%). And since operator 1 is now inputting rows, and this is the only other memory using operator at this time, we might expect the Memory Fractions Input property of this operator to show the remaining 0.428571. The screenshot to the right shows that this is indeed the case.
This tells us something about the estimated memory requirement for operators 1 and 2, relative to each other. Apparently, the optimizer thinks that operator 2 needs 33% more memory than operator 1. But we still do not know whether we can safely relate this to the full Memory Grant. There are more phases left to explore.
Third stage
Eventually, either Clustered Index Scan 6 runs out of rows, or Top 5 reaches its row limit. In both cases, the probe input for Hash Match 2 is now exhausted. The response to the GetNext() call is not a row, but the end of data signal. In response, Hash Match 2 itself sends the end of data signal to Hash Match 1.
Hash Match 1 knows that it now has its hash table completed. It closes its build input, by calling the Close() method on Hash Match 2. One of the effects this has is that Hash Match 2 now releases all the memory it was using. After all, it now no longer needs the data it had previously stored in its hash table.
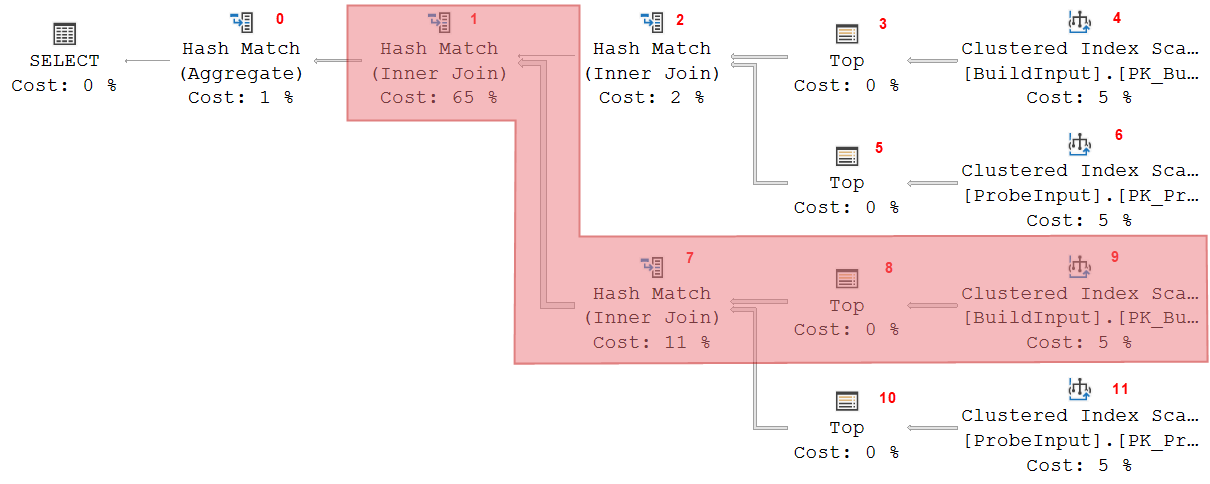
After Hash Match 2 (and also Top 5 and Clustered Index Seek 6) are closed, Hash Match 1 starts its probe phase, so it calls Hash Match 7 and requests a row. Hash Match 7 is now active for the first time. It needs to process its build input first. So in this third stage, all that happens is that Hash Match 7 repeatedly calls Top 8, which calls Clustered Index Scan 9, and all rows returned are stored in the hash table of Hash Match 7. Hash Match 1 is not actively receiving or processing any data, but it does need to keep its own hash table in memory. That’s why this operator is still marked as active in the screenshot above.
At this point we start to see some weird things with the Memory Fractions properties of the various operators. To the right is a screenshot of the Memory Fractions for Hash Match 7; those for Hash Match 1 are further above. Even though Hash Match 1 has now started its probe phase, it has not received or returned any rows yet. So it is still considered to be in the input phase for the purposes of Memory Fractions. Once more the Memory Fractions Input applies, and as we saw above that is 0.428571. Hash Match 7 is of course also processing input, so here we also need to look at the Memory Fractions Input value, which is 0.571429. The values once more add up to exactly 1, and that is of course because the Memory Fractions Input of Hash Match 7 is exactly the same as the Memory Fractions Output of Hash Match 2.
Such a lucky coincidence. Or is it?
Actually, no. It is not. If you check the Estimated Data Size of the build inputs for Hash Match 2 and Hash Match 7, you will see that they are very different. 15MB for Hash Match 2 versus just 9000 B for Hash Match 7. Hash Match 7 requires less memory than Hash Match 2. If you would look at only this third stage and nothing else, then the proper distribution would perhaps have been 65% for Hash Match 2 and 35% for Hash Match 7. But the problem is, we are still in the input phase of Hash Match 2. Only a single value for Memory Fractions Input can be recorded. If we would set this to 0.65, then the total of all relevant Memory Fractions during the second stage of query execution would add up to more than 1. That is never allowed, hence the lowest of the two values (0.571429) is used here. That by itself would result in the total of all relevant Memory Fractions for the third stage to be less than 1. And apparently, Microsoft decided that in such cases whatever memory was left over can be assigned to the operator or operators that do allow a higher Memory Fractions value without causing a problem in any other stage. The Memory Fractions Input for Hash Match 7 could have been kept at 0.35 (or whatever the actual computed value was), and that would in my opinion have been a bit more useful for troubleshooting. But instead, it is bumped to 0.428571, to ensure that the total of all active Memory Fractions in this stage adds up to 1.
In this case, I happen to know that the actual expected memory usage for Hash Match 2 is higher than for Hash Match 7, so I can deduce that the Memory Fractions Input property for Hash Match 7 is artificially bumped, and the Memory Fractions Output of Hash Match 2 is realistic. But I had to use extra information for that. Without that extra information, there is no way to be sure which of the two is “real” and which is “bumped”.
Plus, there is also absolutely no way to determine how much the value is bumped. The figure 0.35 I used in the explanation above is just a random number I grabbed out of thin air. It could also have been 0.4. Or 0.18. The only thing I know for sure is that it cannot be more than 0.428571, since it is always the lower number that gets bumped up, never a higher number that is adjusted down.
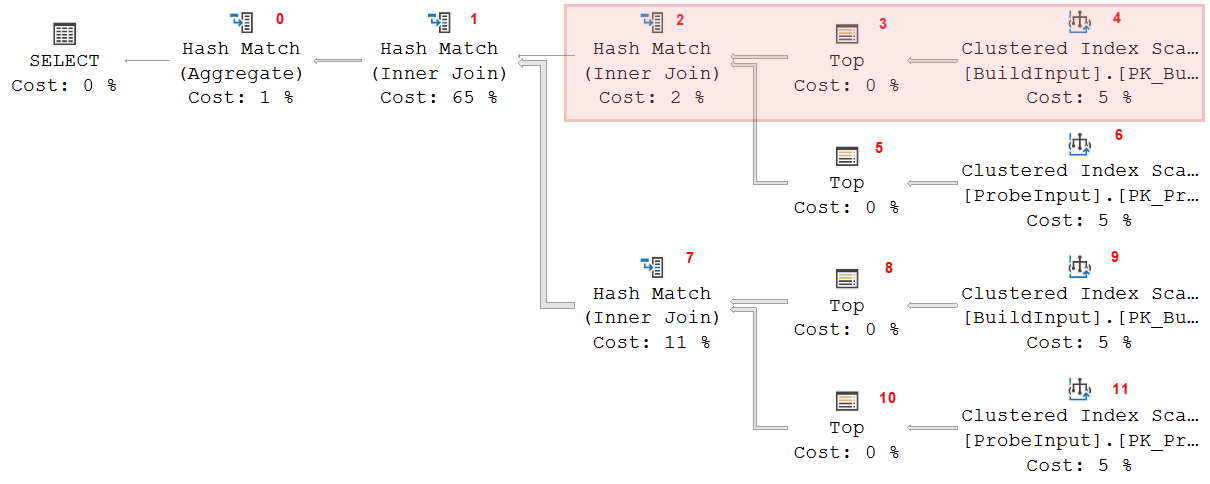
Fourth stage
Once the build phase for Hash Match 7 is over, operators 8 and 9 close. The probe phase now starts. Hash Match 7 requests rows from operators 10 and 11. It matches rows returned to the data in its hash table, and when it finds a match, it returns data to Hash Match 1. This operator is also in its probe phase, so it does the same logic on its own hash table, also outputting matching data to its parent, Hash Match 0 (which does aggregation rather than joining). This operator is now in its build phase, where it stores data in its hash table in memory.
The shaded area once more shows which operators are active. As before, active in this context refers to actually needing memory, although in this stage of execution these operators are also actually passing rows between them.
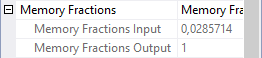
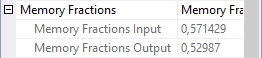
Both Hash Match 1 and Hash Match 7 are now returning data, so they are in their output stage; we need to check their Memory Fractions Output from the screenshots I included above in this post. To the right is the Memory Fractions from Hash Match 0. This operator is in its build phase, so we’ll look at the Memory Fractions Input here. That gives us 0.0285714 for Hash Match 0, 0.441558 for Hash Match 1, and 0.52987 for Hash Match 7. They don’t add up to 1 exactly on your calculator, but that’s because they’re all rounded to six significant digits. For the very low Memory Fractions Input of Hash Match 0, that adds one extra digit because the first 0 after the decimal separator is not a significant digit. Without the rounding difference caused by the representation, the real internal numbers actually do add up to 1. We once more have some interesting information about estimated memory usage for these three operators relative to each other. But we still cannot relate that to the total Memory Grant of the query.
After all, we do know that the total required memory for the first stage was less than for the second stage. And by using extra information outside of just the Memory Fractions, we were also able to conclude that the third stage needs less memory than the second. But we have no way to know whether the total required memory of this fourth stage is more or less than the second stage.
Fifth stage
Just for completeness sake, let me quickly finish the analysis. Once the probe input for Hash Match 7 returns no more rows, this operator returns the end of data signal to Hash Match 1, which in turn returns end of data to Hash Match 0. Both Hash Match 1 and Hash Match 7 can now close. They release their memory, because their hash tables are no longer needed.
Hash Match 0 then enters the “final” phase, where it simply returns data from its hash table, one row at a time. Its hash table remains in memory at this time. But no other operators need memory. All available memory can be used for this only active operator, hence the Memory Fractions Output is set to 1.
Conclusion
If you are willing to put in the work, you can work through all the stages of execution in an execution plan. For each stage, some operators are not yet using memory, some are not using memory anymore, and some operators do use memory. Those that do use memory are either in their input or in their output phase.
For each stage, the relevant Memory Fractions Input and Memory Fractions Output can be used to assess the relative expected size of the memory usage of those operators. But beware. When the “raw” numbers would add up to less than 1, the optimizer increases these numbers where possible. I suspect that this is so that these numbers can be used at runtime to optimize memory management, and it would be a shame to let a part of the available memory go to waste. But that does have the side effect that we often don’t know whether the numbers in the plan are an actual representation of the relative memory requirement, or if they are bumped.
The Memory Grant of the entire execution plan is based on the total estimated required memory for the most expensive phase. But it is usually not possible for us to see which stage has the highest estimated required memory. Which means that there is not a single phase for which we can safely multiply the Memory Fractions with the Memory Grant to get the estimated required memory for individual operators.
If you want to know how much each individual operator contributes to the Memory Grant, then you will either need to know what data each operator stores in memory and then use the estimations of that data in the plan to get an idea, or you can vote for my suggestion to add estimated memory usage of individual operators as a new property in execution plans.


1 Comment. Leave new
[…] Hugo Kornelis explains the notion of memory fractions: […]