I recently wrote about the Actual I/O Statistics property that you can find in an execution plan plus run-time statistics, which allows you to see exactly how much I/O was done by each individual operator. This is a great feature and I’m very happy with it. But, as I already indicated at the end of that post, there are some issues as well. Let’s take a look at the dark side of this property.
Error, does not compute
So, let’s look at an example, based on this simple query:
SET STATISTICS IO ON;
SELECT sod.OrderQty,
       sod.UnitPrice
FROM   Sales.SalesOrderDetail AS sod
WHERE  sod.ProductID = 992;
As you see, I have added the SET STATISTICS IO ON statement. But I then also enable the option to include the execution plan plus run-time statistics (called “Include Actual Execution Plan” in Management Studio, or “Run Current Query with Actual Plan” in Azure Data Studio), before executing the query.

The screenshot above shows the output that SET STATISTICS IO ON produced in the Messages pane. (Note that this is based on a repeated execution; a first execution may return different results due to data not being in the buffer pool; that’s not in scope for this post). So this clearly shows that 722 logical reads were done in total to execute this query.
Let’s look at the execution plan to see what operator, or operators, caused these logical reads to happen.
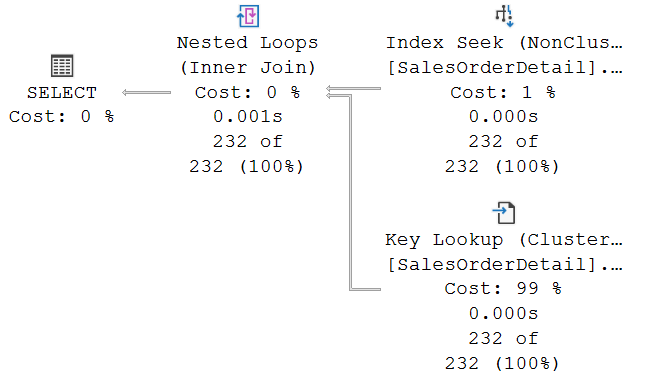
As you can see, the execution plan is really very basic. Not a surprise, given how simple the sample query is. The Index Seek uses a nonclustered index on ProductID to find all rows in SalesOrderDetail that have ProductID equal to 992. That index does not include the OrderQty and UnitPrice columns, so Nested Loops asks, for each row returned, the Key Lookup operator to fetch those two columns.
The Nested Loops operator and the SELECT icon (that’s not actually a real operator) don’t do any I/O. If you check their property lists, you will not find the Actual I/O Statistics property. This property is, by design, only present on operators that have the ability to do I/O.
The two other operators, Index Seek and Key Lookup, can do I/O. They do have the Actual I/O Statistics property in an execution plan plus run-time statistics. And in this case, since they both perform I/O on the same table, that is useful to find out how those 722 total logical reads are distributed between the two operators.
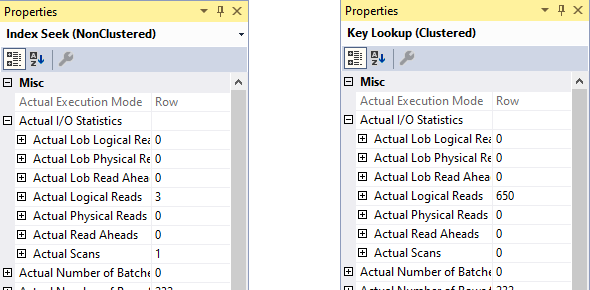
So let’s check. The picture above shows, side by side, the properties of the Index Seek and the Key Lookup operator. They show that the Index Seek did 3 logical reads only, while Key Lookup did 650 logical reads. A clear indication where the majority of the work is done.
But wait. Aren’t we missing something?
The SET STATISTICS IO ON output indicates a total of 722 logical reads. The two screenshots above add up to 653 logical reads. Where are the other 69 logical reads?
Also, clustered index on SalesOrderDetail is three levels deep (root level, one intermediate level, and leaf level). With 232 executions of this operator, I would have expected 696 logical reads, not just 650. What’s going on?
Prefetching
Before I can explain these apparent inconsistencies, I need to explain a rather advanced optimization of the Nested Loops operator: prefetching. What this is and how it works is described, in broad strokes, on the Nested Loops page of the Execution Plan Reference. But in this case, I suggest you read Paul White’s explanation, because Paul goes deeper into some details that are required to understand the rest of this post.
The Nested Loops operator of the execution plan above does use prefetching, as can be seen in its property list. So I decided to follow Paul’s example and use my photoshop skills to visualize the “hidden” extra operator. I also blatantly copied Paul’s name for this extra operator.

With this version of the execution plan visualized, I can explain in more detail what happens when the query executes. As always, control starts at the top left, with SELECT asking Nested Loops for a join. Nested Loops then requests a row from Delayed Prefetch, which in turn forwards the request to Index Seek. Index Seek reads some data to return a row to Delayed Prefetch, which then passes that row to Nested Loops. Nested Loops then requests a row from Key Lookup, returns the combined result to SELECT, and then the process starts all over again. No surprises here.
Except that Delayed Prefetch, for some of the rows (based on rules that are undocumented and that I have so not been able to work out), checks whether the data is in the buffer pool. And this happens, apparently, 23 times for this query. Each of those 23 times, Delayed Prefetch incurs three logical reads, as it navigates the index to check whether the next page to be read is already in the buffer pool. That racks up to 69 logical reads total, exactly the 69 logical reads that we were missing. If we would be able to actually get an execution plan from SQL Server with the Delayed Prefetch operator still included, then we would see that it reports 69 logical page reads in the Actual I/O Statistics property. And then the totals would add up exactly.
Key Lookup optimization
But that does not yet explain the 650 logical reads of the Key Lookup. That operator still executed 232 times. It still had to read 232 rows from the clustered index. But Microsoft added a small optimization. When Delayed Prefetch checks to see whether a page is already in cache, it tells Key Lookup what page to use. And Key Lookup uses that information to save itself some work. Instead of using the clustered index key values passed in to navigate the index and find the page to be read, it uses the page that Delayed Prefetch told it to use directly, skipping the root and intermediate levels.
So this means that, out of the 232 executions for Key Lookup, 23 of them use the optimized access path enabled by Delayed Prefetch to go directly to the leaf page. Those 23 executions weigh in at 23 logical reads. The remaining 209 executions do not benefit from Delayed Prefetch, so they have to follow the normal method of using the key values to navigate the index. As mentioned before, the index has three levels, so these executions each incur three logical reads, for 627 logical reads total. Add the 627 logical reads for 209 normal executions to the 23 logical reads for the 23 optimized executions, and we have an exact explanation for the 650 logical reads from the Key Lookup.
To visualize the invisible
As mentioned above, if the Delayed Prefetch operator were visible in the execution plan, then we could see all the I/O, in their correct location, by looking at the Actual I/O Statistics property. But unfortunately, the Delayed Prefetch is not visualized. Microsoft decided to expose this functionality as an optimization of the Nested Loops operator, and not as a separate operator. That was all fine and dandy when this was built. But after deciding to expose the Actual I/O Statistics for each operator, it suddenly backfires and causes confusing and misleading information in the execution plan.
However, even though not visible in the graphical execution plan, nor even in the underlying XML, there is still a way, using documented features only and no debugger, to see what the real execution plan does. The trick is to query the sys.dm_exec_query_profiles DMV at just the right time. Which can be made easy by smart use of locking. (And I must point out that all credits for this idea go to Paul White).
Adding the SalesOrderID and SalesOrderDetailID columns to the query does not change the execution plan shape. So this is a good way to check which row is returned last. Since all operators are order-preserving in this case, that is also the row that is processed last. I can use the values found to ensure the Key Lookup gets blocked when it reads its very last row by having an uncommitted modification in another window:
BEGIN TRANSACTION;
UPDATE Sales.SalesOrderDetail
SET    OrderQty = 999
-- Last row processed by the SELECT query
WHERE  SalesOrderID    = 73957
AND    SalesOrderDetailID = 118614;

--ROLLBACK TRANSACTION;
I run this query, then once more run the SELECT statement. It obviously will not finish. But now I know that, when I query sys.dm_exec_query_profiles, the data I read are the almost final run-time statistics. So I check the session_id (aka “spid”) of the session that is running the SELECT and plug it into the query below:
SELECT physical_operator_name,
       node_id,
       row_count,
       logical_read_count
FROM   sys.dm_exec_query_profiles
WHERE  session_id = 52;  -- Replace as needed
The results, when I executed this on my laptop, are as below:
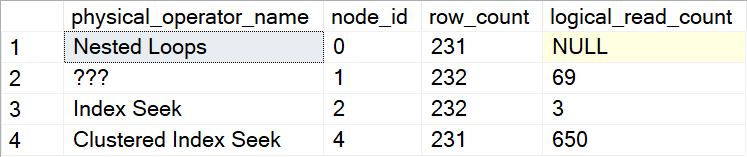
You’ll recognize the Nested Loops and Index Seek operators from the graphical execution plan. They report exactly the same logical_read_count as expected, and as will show up in their Actual I/O Statistics property when I look at the execution plan plus run-time statistics. The Clustered Index Seek might surprise you, but the node_id shows that this is actually the Key Lookup operator. As explained on the Key Lookup page in the Execution Plan Reference, a Key Lookup is actually a Clustered Index Seek that is given a different name to clarify its function in the context of the execution plan. The sys.dm_exec_query_profiles doesn’t know about this name change and therefor reports it under its real name.
And then there is row 2, for an operator with node_id 1 and no name. Not even in sys.dm_exec_query_profiles. This is the operator that Paul White, based on names in the stack trace he found in the debugger, has dubbed the Delayed Prefetch operator. Just as this DMV does not know that it should call a Clustered Index Scan by a different name in this specific context, it clearly also doesn’t know that this operator should be hidden. And hence it isn’t.
Conclusion
This blog post is a bit of everything. On the surface, I looked at an inconsistency in how SQL Server reports actual I/O statistics in execution plans. The reporting is done on a per operator basis, but in the example shown here some of the I/O was done by a hidden operator. And since that operator is not visible, the associated I/O’s are not reported.
But you can also see this post as an in-depth look under the covers. It reveals that, even with all the details that execution plans expose, there’s still a lot of stuff hidden underneath. And sometimes, when you know where to look, you can get an unexpected glance.
But my bottom line has to be that, in my opinion, all activities should be visible in the execution plan. Imagine building a monitoring tool that uses the Actual I/O Statistics property in execution plans to give users detailed insight in what queries, and what elements within those queries, are hammering their system. And imagining then getting a call from a paying customer that their numbers don’t line up, and you get the blame for, effectively, Microsoft not reporting all activities correctly.
For the query and execution plan in this example, I would rather have seen the I/O done by the prefetching reported in an Actual I/O Statistics property on the Nested Loops operator. That’s still not totally accurate, but closer to the truth than what we get now. However, better still would be if Microsoft would stop hiding the operator. I get that less experienced users might get confused over seeing a new operator, but that’s one time only – once they educate themselves on what the operator does, they’ll always understand going forward. And it allows for a far better representation of what actually happens when these queries run.


1 Comment. Leave new
[…] Hugo Kornelis looks at when worlds collide: […]