One of the things that many people look at when tuning their queries is the amount of I/O required per execution. Of course, when the CEO is waiting for their favorite report to render, we only care about elapsed time. But for most other queries, especially for those that run thousands of times each day, reducing I/O is often our main objective.
The old ways
The standard method to get insight in the amount of I/O that was done while executing a query is to precede the query with the statement SET STATISTICS IO ON . (The same setting can be achieved from a setting in Management Studio, but I hardly see people using it; the SET statement appears to be the almost universal method). Here’s an example:
SET STATISTICS IO ON;
SELECT sod.SalesOrderID,
       sod.SalesOrderDetailID,
       sod.OrderQty,
       sod.ProductID
FROM   Sales.SalesOrderDetail AS sod
WHERE  sod.OrderQty >
    (SELECT COUNT(*)
     FROM   Sales.SalesOrderDetail AS sod2
     WHERE  sod2.ProductID = 744);
If I run this query, I get my query results, as expected. And unless I changed a setting, it would be in the grid tab of the results pane. But there is also a Messages pane, and when I switch to that I see a message such as shown below:
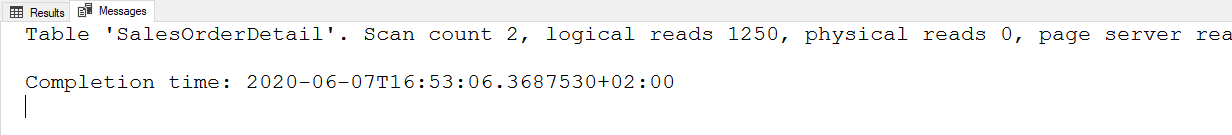
The most relevant number in this output is the number of logical reads: 1250. That’s how often SQL Server requested a page to be read. Each of them could have been a physical read too, if that page had not already been in the buffer pool. But in this case, since I had already run some queries on the same data, all data was already in the buffer pool and only logical reads were needed.
Do note that, in this case, the output is very simple: just a single line. That’s because just a single table is being accessed in the queries. Real queries on real production systems tend to be a lot messier, and then the SET STATISTICS IO output can be rather hard to read. A good solution for that is the online Statistics Parser, a free to use tool (built by Richie Rump) where you can paste the entire statistics output of a query, and it will parse the data and present it in a much more convenient way.
Limitations
But this tried-and-tested method is not without limitations. Let’s say that the query above is found to cause performance problems, and I’ve been asked to tune the query. I look at the output above and agree that 1250 logical reads is way too much, given how often this query runs. I need to reduce it. So let’s look at the execution plan of the query:
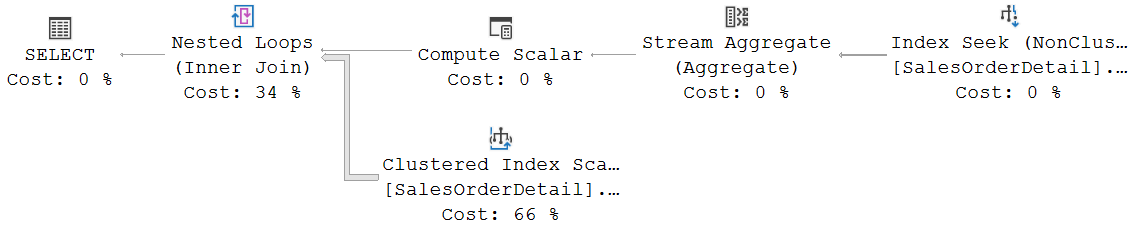
There are two operators that read from the SalesOrderDetail table (or from indexes on that table). The top right operator is an Index Seek on one of the nonclustered indexes on SalesOrderDetail, and on the bottom input of the Nested Loops operator is a Clustered Index Scan that scans the clustered index on the same table.
So, now what? Which of the two is in this case the problem? Is each doing exactly 625 logical reads? Is one doing 50 and the other 1200? For the longest time, there was no way to find out. Sometimes you could make an educated guess by looking at the rest of the execution plan. Sometimes you can get an idea by running other queries with similar plans and check their logical reads (like in this case, you could run the subquery by itself and that would work). But none of these methods are really satisfactory.
New kid on the block
But there’s good news. Microsoft has invested, heavily, in data returned in execution plans. A lot of new properties have been added in the recent versions, and some were even backported.
The property I want to talk about here is called Actual I/O Statistics. It was introduced in SQL Server 2017, and then backported to SQL Server 2016 and SQL Server 2014, and I have already blogged about it before. But it’s important enough to mention it again.
Now unfortunately (but also rather obviously), this property is only included in the execution plan plus run-time statistics (aka “actual execution plan”). So we will need to actually execute the query again while capturing the execution plan plus, and then we can dig in.
 To see the Actual I/O Statistics property of any operator, you need to highlight the operator and then go to the properties window. You will see a line for the Actual I/O Statistics property, and you can click the + sign to the left of it to expand its sub-properties, as shown in the screenshot on the right. (Note that not all operators have an Actual I/O Statistics property, you will only find it on operators that can actually do I/O).
The screenshot included here is for the Clustered Index Scan in the execution plan shown above. Now it is easy to see that, if we want to optimize the query, we should focus on this operator. 1248 of the total 1250 logical reads are caused by this operator. That means only 2 are caused by the Index Seek (and if you check the properties of that operator, you will indeed see this confirmed).
I like it when I don’t have to guess. I like it when SQL Server gives me data to work on. So in short, I like this new property!
Conclusion
Demos are always simple. Real issues never are. Real execution plans tend to be large, complex, and messy. The best way to tackle them is to focus on problem areas only and forget about the rest.
With the Actual I/O Statistics now reported per operator in the execution plan plus run-time statistics, it has gotten a whole lot easier for us to find which areas are those problem areas. We can now immediately see how much I/O work was, in reality, done by each operator. The data is there. Use it!
But do keep in mind that, despite the “/O” in the property name, it actually only reports reads. Writes are not reported at all. Not in SET STATISTICS IO , and not in the Actual I/O Statistics property either.
Oh, and then there are some other issues with this property too, but those will be the subject for another blog post.
(EDIT: Corrected a minor mistake and two typos. Thanks, Eugene!)


3 Comments. Leave new
[…] Hugo Kornelis talks about a fairly recent property in execution plans: […]
[…] recently wrote about the Actual I/O Statistics property that you can find in an execution plan plus run-time […]
Thanks for the common sense suggestions! I agree that most demos present very controlled, simple scenarios.