Troubleshoorting performance issues can be hard. Having as much information available at our fingertips does not magically make this easier but it does at least save us the burden of having to collect that information from other places. That’s why I like how much extra information Microsoft has been adding to execution plans in recent releases.
During this year’s PASS Summit, I went to a session presented by Pedro Lopes and Joe Sack. Pedro explained in his half of the session that Microsoft has the goal of making sure that everything we need for troubleshooting will be available in the execution plans, and he showed a recent improvement that has me very excited.
How long did that take you?
But let’s first look at a slightly older improvement.
When I am tuning a query, I am not always looking at the same metric. Sometimes I want the query to finish as fast as possible, especially when the CEO is waiting for their favorite report to finish. Sometimes I want it to take as few CPU cycles as possible, especially on a server that has extreme CPU pressure. And sometimes I want to minimize logical IOs when the server is mostly restrained by IO speed and buffer pool usage.
For the first two metrics, SET STATISTICS TIME ON has always been my friend. For those who have never used this, here is what you will see in the messages pane after running a test query with this option enabled:
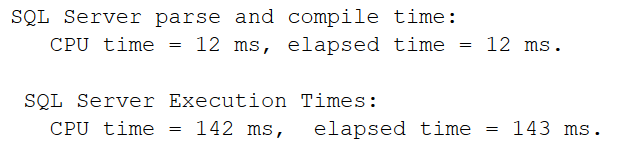
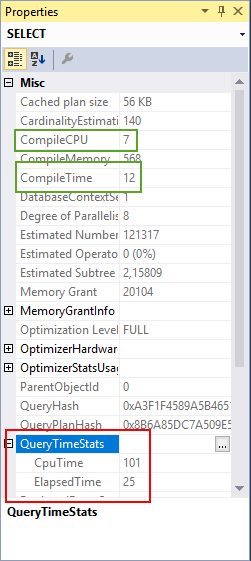
The first line shows the effort required to compile the execution plan. This can be useful if you are for instance working with extremely complex issues and you suspect that the optimizer may be spending too much time on this. This same data has also been included in the execution plan, since as long as I remember. You can see it by right-clicking on the top-left operator of the execution plan and then selecting “Properties”. (Or if you are like me and leave the properties window open at all time, just click on that operator to make it the focus of the properties window). See the green boxed areas in the screenshot below. (You may notice that the values are not exactly the same. They are measured in different ways. However, they are always close enough that I feel safe to use either option).
 The second part of the
 SET STATISTICS TIME output shows the same details of time elapsed and CPU time used for when the execution plan was actually executing. This is often far more useful – after all, most queries run longer than they compile, and they also execute more often because the execution plan gets stored in the plan cache. So the elapsed and CPU time of the query execution is a far more useful metric.
This metric was for a long time not avaibale in the execution plan – but recently this was added (and even backported to earlier versions). The red boxed area in the screenshot shows the QueryTimeStats node, which can be expanded to show the CpuTime and ElapsedTime properties. Again, the values differ slightly from the values that SET STATISTICS TIME shows, but the differences are really minor.
Since these values are now included in every execution plan, I would argue that there is no need anymore to ever use SET STATISTICS TIME ON. The overhead this command causes may be very small but I still prefer no overhead at all!
Enter the new era!
To quote late night advertorial TV programs: “but wait … there’s more!”
If you upgrade SQL Server 2017 to the latest Cumulative Update (CU12 at the time I write this), then you may see even more data under the QueryTimeStats node, as shown in the next screenshot:
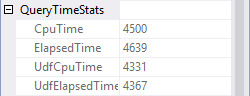 In this case the execution plan shows not only the CPU time and elapsed time for the entire execution plan, it also shows the CPU time and elapsed time that was spent while evaluating scalar user-defined functions (UDFs). This is really fantastic! I mean, I already knew that scalar UDFs can be bad for performance but in this case I can even tell exactly how bad they were for this query – almost all the CPU and elapsed time for this execution were spent on scalar UDFs! If this is the query that I need to tune to fix a performance issue in the finance department database, I know right away that I do not even need to look at the execution plan of the query itself. I can jump right into the scalar UDFs used by the query.
And conversely, if I see a very low number for the UdfCpuTime and UdfElapsedTime properties, then even though a scalar UDF is used by the query I know that it does not cause the issues this time and that I should focus on the main query.
Previously this information was not available in any way other than running a relatively expensive Extended Events session on the server all the time.
When I saw Pedro present this, I got very excited. Big thumbs up to Microsoft!
Breakdown
 Another feature that is available in execution plans but not in
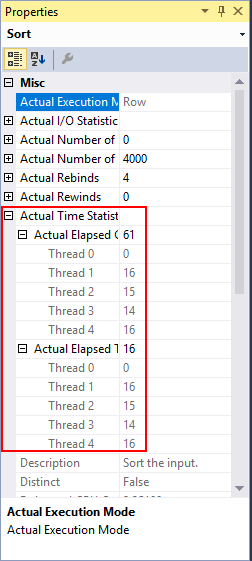
 SET STATISTICS TIME, since SQL Server 2014 already, is the specification of elapsed and CPU time per operator. See this screenshot for an example of how the properties of a single operator within a sample execution plan might look.
As you can see in the red marked area, I can see exactly how much CPU time (confusingly marked as “Actual Elapsed CPU Time” and elapsed time this operator used. And I can see this for each thread in a parallel plan. This makes it far easier to find out which operators in a complex plan cause it to be slow, or to identify issues cause by parallelism skew.
Unfortunately, the per-operator display of CPU usage and elapsed time does not expose the time spent in scalar UDFs. Yet (?).
But what about the I/Os?
As mentioned before, I am not always interested in the same metric when tuning. What if I am primarily interested in reducing the number of logical reads? I obviously can use the SET STATISTICS IO ON statement to get output such as shown below (click to enlarge) after running the query:

But wouldn’t it be nice if this information, too, was available within the execution plan itself? Turns out, today is our lucky day!
In the screenshot above you may already have noticed the “Actual I/O Statistics” node. This node is not included in all operators, but you will see it on each operator that does (or even might do, e.g. in the case of Sort or Hash Match operators that may spill) I/O while executing. 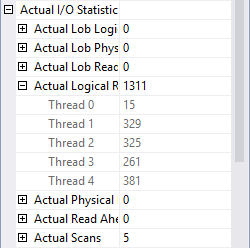 Expanding that node gives me a very nice breakdown of the I/O done by each of the operators in the execution plan. It shows the same information
 SET STATISTICS IO shows, but again broken down per operator and per thread.
However, where CPU time and elapsed time are shown by operator, and shown aggregated for the entire plan, that is not the case for the I/O statistics. If I want to get the total for the query, I will have to go through the entire plan and manually tally up all the numbers – or continue to use (and accept the overhead of) SET STATISTICS IO ON.
Another shortcoming that I see in this per-operator display of the I/O statistics is that it does not show how many segments were eliminated, a very handy feature that has been added to the SET STATISTICS IO output a few years ago and would be nice to have inside the execution plan as well.
However, despite all the shortcomings it is of course incredibly useful to have all this information available in the execution plan.
Never satisfied…
With so much goodness in the execution plans, you might be excused for expecting me to be perfectly happy and satisfied right now. But you would be wrong. Those who know me better know that, regardless of how happy I am with any given feature in SQL Server, I will always continue to press Microsoft to do even better.
I have decided to list all my wishes here. But I have also added all these wishes as requests on User Voice, Microsoft’s new feedback channel for SQL Server related issues. The list below is in random order as I want all these features equally much. However, if you think that some are more important than others, let Microsoft know by voting and/or commenting on the items.
- Show total I/O for the entire execution plan in the top-left node. The QueryTimeStats node on the top-left operator shows the total time for the entire execution plan which saves us the effort of having to tally up all the data from the Actual Time Statistics nodes of each individual operator. It would be great if there was a similar QueryIOStats node to immediately see the total logical and physical reads for all operators in the plan combined.
- Show I/O from user-defined functions in execution plan. The addition of UdfCpuTime and UdfElapsedTime to the QueryTimeStats node in an actual execution plan is a huge step forward, but I/O done from a scalar UDF is often an even higher problem and there is currently no way, other than an Extended Events session, to get insight in that. It would be awesome if Microsoft can add this to the execution plan, either for the node where the UDF is invoked or for the plan as a whole (ideally both). It does not have to be broken down for each individual table, it can be a grand total if that is easier to implement.
- Add count of logical writes to
SET STATISTICS IOand to Actual I/O Statistics in execution plans. Currently neither the output ofSET STATISTICS IOnor the data captured in the Actual I/O Statistics property in execution plans expose the number of logical writes. For Insert, Update, Delete, and Merge operators, this is a minor nuisance; usually the number of logical writes is well known and it is definitely seldom surprising. But for operators that use worktables and workfiles, such as Table Spool or Hash Match, there currently is no way to see how many logical writes were used. This can, for instance, cause a many-to-many Merge Join to show only a very low number of logical reads to the worktable because there were very few actual duplicates in the data, while hiding the perhaps millions of logical writes that may be an actual performance problem in the execution plan. - Add segment elimination data to Actual I/O Statistics in execution plans. Operators that have the ability to do I/O show their Actual I/O Statistics in an actual execution plan, allowing developers and DBAs to gain insight in the amount of I/O done for each individual operator. However, the information about number of segments read and number of segments eliminated that has been added to
SET STATISTICS IOfor queries that involve columnstore indexes is not included in the Actual I/O Statistics. It would be very useful to have this information there as well. - Add CPU and elapsed time for UDFs to ActualTimeStatistics. The addition of UdfCpuTime and UdfElapsedTime to the QueryTimeStats node in an actual execution plan is a huge step forward. But it would be very useful to also have this information on a per-operator level, especially in plans where multiple operators invoke scalar user-defined functions.
NOTE: Today (December 5), I updated this post. Eugene Karpovich pointed out that I had mistakenly typed SET STATISTICS IO instead of SET STATISTICS TIME multiple times in the first part of the post. This is now corrected. Thanks, Eugene!!


1 Comment. Leave new
[…] introduced in SQL Server 2017, and then backported to SQL Server 2016 and SQL Server 2014, and I have already blogged about it before. But it’s important enough to mention it […]