This is the last part of my blog series about the internals of hash tables in SQL Server. In part 1, I introduced a trick to get data returned in the order of the hash table, that I used in part 2 to gain an understanding of its internals. I then built on that in part 3 to find examples of hash collisions.
With that, the discussion of the in-memory structure of a hash table is over. But what if we run out of memory and have to spill to tempdb? How is the spilled data stored on disk?
I will in this blog post not talk about all the stages that a hash spill can go through. If you want to know more about that, you can look at this slide deck. I will just force a Hash Match operator to spill, and then investigate the data in tempdb.
Setting up the test
Finding data in tempdb is hard. Not when the data is in objects we created ourselves, such as temporary tables or variables. They are stored in the internal system tables and reflected in various system dynamic management views. But that changes for internal objects. They are only used by the internal logic of, in this case, the Hash Match operator. There is no advantage to storing them in the system tables. When I explored the internals of tables used by Table Spool, Index Spool, and Window Spool, I found out that Microsoft has indeed not bothered to put anything in the system tables for such internal objects. The Hash Match operator is not different in this regard.
But I still found a way to locate this information. You can read this article if you want to understand the full process I followed. Here, I will just give a quick summary of the approach that worked then, and that I will use again today.
I first installed a separate instance of SQL Server (2022 in this case). Instead of following best practice, I set it up to use just one single tempdb file. That makes it easier to find the internal object, because I only have to search in that single file. I sized this file at just 10 MB; I’ll explain why in a bit. I have also set the maxdop setting to 1, because serial execution is easier to control and has a more predictable order of execution than parallel execution plans.
EXEC sys.sp_configure 'show advanced options', 1;
RECONFIGURE WITH OVERRIDE;
EXEC sys.sp_configure 'cost threshold for parallelism', 1;
RECONFIGURE WITH OVERRIDE;
The next part is to run a query that forces a Hash Match operator to spill to tempdb, and then have it wait for a locked resource before it can finish. That will give me the time to do all my investigation, while the spilled data just sits there in tempdb, waiting for the blocked query to resume. I’ll get back to that part of the process in a bit. Let’s first look at the other steps that are needed. Because, as mentioned, SQL Server does not store any data at all in the system tables that are reflected in DMVs such as sys.objects or sys.columns. Since the object is only used by the operator itself, it can just store all the relevant metadata in operator memory.
However, there are some system objects that do need to be maintained. Even though the object is only used by the operator’s internals, we are still running on a multi-user system where other connections also use tempdb. It would be bad if those connections read and write data on the same pages in tempdb where our spilled hash table is stored. SQL Server needs to ensure that no other process can use these pages. SQL Server tracks which pages in a database file are free or available, in the so-called PFS (Page Free Space) page. In database files of up to approximately 64 MB, there is just a single PFS page. So to make sure we never have to worry about a second PFS page, I use a tempdb file that is smaller than that size.
Finally, I expect that I might have to run the same query multiple times before I finally get everything right. That means that Memory Grant Feedback will kick in and adjust the memory grant. Which is great for actual production queries, but totally sucks for what I try to do in this blog post. So after creating a database for testing, I disable this feature:
USE HashTest;
ALTER DATABASE SCOPED CONFIGURATION SET ROW_MODE_MEMORY_GRANT_FEEDBACK = OFF;
With this, I have the basics in place. All I now still need is tables with test data, a query that causes a hash spill, and a way to block that query, so that it won’t complete.
Creating test data
In order to force Hash Match to spill, we need a build input that is larger than the assigned Memory Grant. So we need a sufficiently large amount of data in a table. I can of course try to find this in one of Microsoft’s demo databases. Or I can create my own demo table. I chose the latter, because that enables me to make test data that is ridiculously easy to recognize once we get to the stage of looking at pages in tempdb.
USE HashTest;
GO
DROP TABLE IF EXISTS dbo.Build, dbo.Probe;
GO
CREATE TABLE dbo.Build
    (KeyCol  int        NOT NULL PRIMARY KEY,
     DataCol nchar(5)   NULL,
     CharCol char(2000) NULL);
CREATE TABLE dbo.Probe
    (KeyCol  int        NOT NULL PRIMARY KEY,
     DataCol nchar(5)   NULL,
     CharCol char(2000) NULL);
GO
WITH LotsOfRows
AS (SELECT     TOP (10000) ROW_NUMBER () OVER (ORDER BY (SELECT 1)) AS rn
    FROM       sys.objects AS o1
    CROSS JOIN sys.objects AS o2
    CROSS JOIN sys.objects AS o3)
INSERT INTO dbo.Build (KeyCol, DataCol, CharCol)
SELECT rn,
       'X' + RIGHT((rn % 1234) + 10000, 4),
       LEFT(REPLICATE ('Build ' + RIGHT(rn + 1000000, 6) + ' ', 200), 2000)
FROM   LotsOfRows;

WITH LotsOfRows
AS (SELECT     TOP (10000) ROW_NUMBER () OVER (ORDER BY (SELECT 1)) AS rn
    FROM       sys.objects AS o1
    CROSS JOIN sys.objects AS o2
    CROSS JOIN sys.objects AS o3)
INSERT INTO dbo.Probe (KeyCol, DataCol, CharCol)
SELECT rn,
       'X' + RIGHT((rn % 1234) + 10000, 4),
       LEFT(REPLICATE ('Probe ' + RIGHT(rn + 1000000, 6) + ' ', 200), 2000)
FROM   LotsOfRows;
With these tables, I can now create a query that will cause a spill to tempdb:
USE HashTest;
GO
DECLARE @t int = 178;

SELECT          *
FROM            (SELECT TOP (@t) * FROM dbo.Build ORDER BY KeyCol) AS b
INNER HASH JOIN (SELECT TOP (@t) * FROM dbo.Probe ORDER BY KeyCol) AS p
   ON p.DataCol = b.DataCol;
After some trial and error, I found that the value 178 for @t is the lowest where a spill is reported. I can of course use a higher value, but I want the amount of data written to tempdb to be as low as possible, so that there are less pages to investigate if I want to check all. Of course, if the goal is to find just a single page with spilled data, then increasing @t to force a much larger spill would make that easier – the more spilled pages exist, the higher the chance of finding one even when looking at random pages.
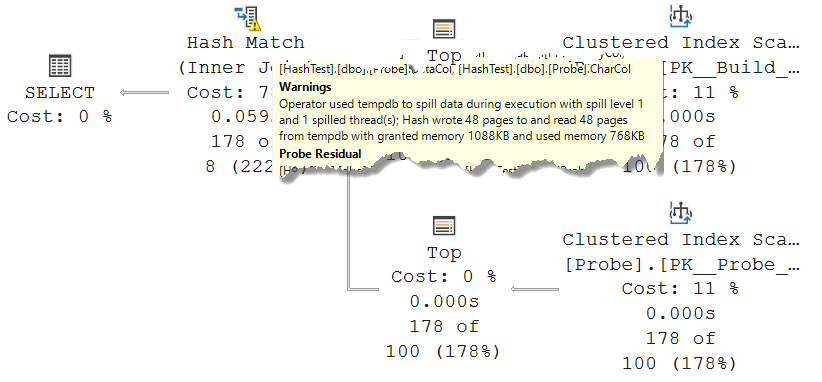
I went with @p = 178, though, so that I can investigate all pages if I want to. As you see in the screenshot, there are already 48 pages of spilled data in this case. More than enough, for my liking!
Despite the spill, the query finishes very fast. Typically below 100 milliseconds on my laptop. I need more time than that to investigate the spilled hash table! As already mentioned, the way to do that is to ensure that the query can’t finish, by forcing it to wait for a locked resource.
There are multiple approaches to this. I could change the query to an INSERT … SELECT statement and ensure that the target table has a conflicting non-committed row. Or I could just put an exclusive lock on one of the input tables, so that one of the Clustered Index Scan operators will have to wait until the lock is lifted. Which method of locking I use might influence what data will be spilled. Again, the internals of the spill process are beyond the scope of this post. In this case, I choose to lock the very first row of the probe input, so that the spilled data will contain the part of the build input that was swapped out of memory, but no data from the probe input yet.
-- Run this in a separate connection
USE HashTest;
GO
BEGIN TRAN;

SELECT *
FROM   dbo.Probe AS p WITH (XLOCK, HOLDLOCK)
WHERE  p.KeyCol = 1;

--ROLLBACK TRAN; -- Run this when done with testing
At this point, I want to make sure that I do indeed block the process at exactly the intended moment, so when the build input has fully processed, and the probe input was requested to return the first row. Running the join query with the Live Query Statistics option turned on does indeed confirm that I achieved what I set out to do:

Now, we should have data in tempdb, though perhaps not quite 48 pages yet. That data can only be the spilled buckets from the hash table. So a subset of the 178 rows in the build input. All that’s left to do is to find the pages in tempdb where this data is stored, and then take a detailed look at the structure of that data.
Finding the data
But finding the spilled records is still not easy. Sure, we can look at the PFS page, and then inspect allocated pages one by one. Great idea … if you are really bored and would love to kill a few hours. Even right after starting the instance, there are already over 400 pages marked as not free in tempdb. These are used for all kinds of internal processes that I don’t want to worry about. I only want to see the pages that were allocated after starting the query. So that means that I have to make a snapshot of the PFS page, then run the query (making sure to block it so it never finishes), and then take a second snapshot of the PFS page. The differences between the two snapshots then indicate pages that are allocated while the query with the spilled Hash Match is running.
Except … except this doesn’t work.
Microsoft has implemented all kinds of optimizations in SQL Server. I discovered one of them, as far as I know not even documented, when I first was looking for internal objects in tempdb (for investigating spools). On a typical production system, tempdb is constantly allocating and deallocating pages. Instead of updating the PFS pages every time, tempdb keeps its own internal pool of already allocated pages. When an object is destroyed, the page is not marked as free, but kept allocated for future temporary objects. I do not know whether these pages are later deallocated in the PFS page, after a longer time of not being used. I did not want to wait long enough to find out.
Fortunately, tempdb does not pre-allocate this space. On a restart of the service, it all starts clean, and every new allocation in tempdb will indeed result in one or more pages marked as not available on the PFS page. So, if I restart the SQL Server service and then instantly run my test, I should be able to see the differences and find the pages that were allocated when the Hash Match operator spilled.
But let’s first prepare. Step 1 is to run the script that creates the test table, if you have not done so already. Or if you changed data and want to reset it all. After that, we need to set up four tabs in SSMS. One with the join statement, another with the query that creates a lock on the Probe table. If you want, you can execute them again, with the Live Query Statistics, to ensure that it all still works as expected.
Tabs 3 and 4 are then used to compare the PFS page without and with a spilled hash table. They contain this code:
USE tempdb;
GO

-- Inspect the PFS page (page 1 in the data file).
-- (Can also use the GAM page, which is page 2; but then you get allocations at the extent level and may miss some)
--   ====>>>>  Restart the service!!!!!!
-- This is necessary because old structures sometimes remain allocated for re-use,
-- and we can only find the allocated structures by searching for new allocations.
-- Copy query below to new window, then run it.
-- Start & freeze the query, then run same query here and compare results.
DBCC TRACEON(3604); -- Force DBCC PAGE output to screen instead of to errorlog
DBCC PAGE(tempdb, 1, 1, 3);
GO
I like to use the SSMS menu option Window / New Vertical Document Group to get the two tabs side by side, for easier comparison. Adding an extra comment can help me remember which tab is which version. So now, my SSMS screen looks like this:
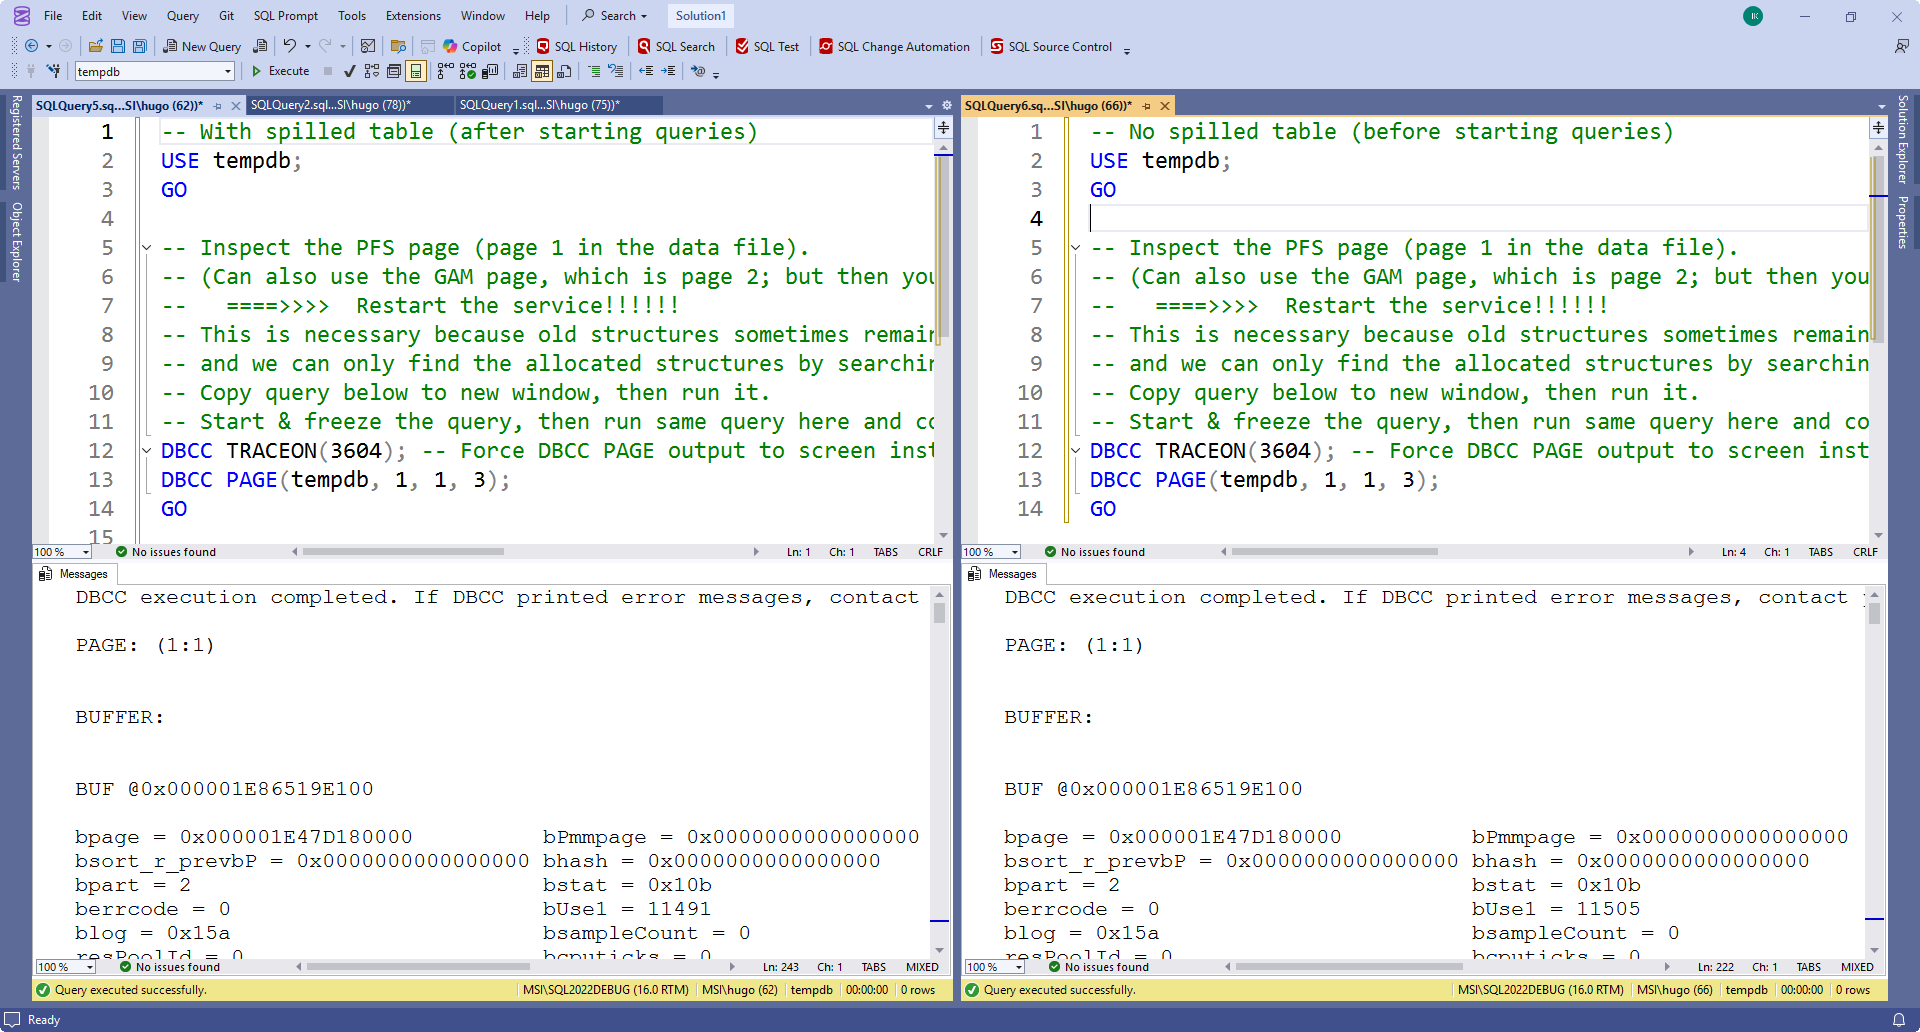
(Note that there are other options. You can also avoid splitting the screen and just constantly Ctrl-Tab between the two tabs when you search for differences. Or you can copy both outputs in an online text comparison tool).
I executed the query in both tabs. This is just to test that the queries work. As stated, we will need to restart the instance and then test to get relevant information here. So, let’s do just that. I stop and restart the instance. Once it is up again, I first run the SELECT query that creates the locks, then the “before” version of the DBCC PAGE query, and then the query with the Hash Match operator. Once that is blocked, I run the “after” version of the DBCC PAGE query. Now, I can scroll down in both side by side windows to look for differences.

Note that the results will most likely be different on your system. They might even differ between one execution of the test sequence and the next! So if you ever need to stop your investigation and resume it later, you can’t trust any saved list of PFS differences. You’ll have to start over.
Analyzing the pages
Now that we can easily find the changed data in the PFS page, it is time to look at the contents of the pages that changed their status. So for each changed page, you need to execute the statement below.
USE tempdb;
GO

DBCC TRACEON(3604); -- Force DBCC PAGE output to screen instead of to errorlog
DBCC PAGE(tempdb, 1, 288, 1); -- Replace 288 with page number
GO
Those who know the syntax of DBCC PAGE might wonder why I chose 1 as the print option (last parameter), instead of the more descriptive option 3. The reason is that option 3 can be more descriptive by taking relevant information about the object and its schema from the system tables. And we already know that these internal options are not stored in the system tables. And so, DBCC PAGE does not have the information it needs for print option 3. If you try to use it, you will get an error message in the results.
The bad news is that you will need to do this for all pages with a changed PFS status. Not all of them are part of the worktable. Those that are can be easily recognized, because we have prepared the Build table with data that is easy to recognize.
Another hint is in the page header. If a page was allocated as part of one of the many internal system tables in tempdb, then the ObjectID will be stored in the page header. Pages that are used for the spilled data do not have an ObjectID, so the m_objId property will be 0.
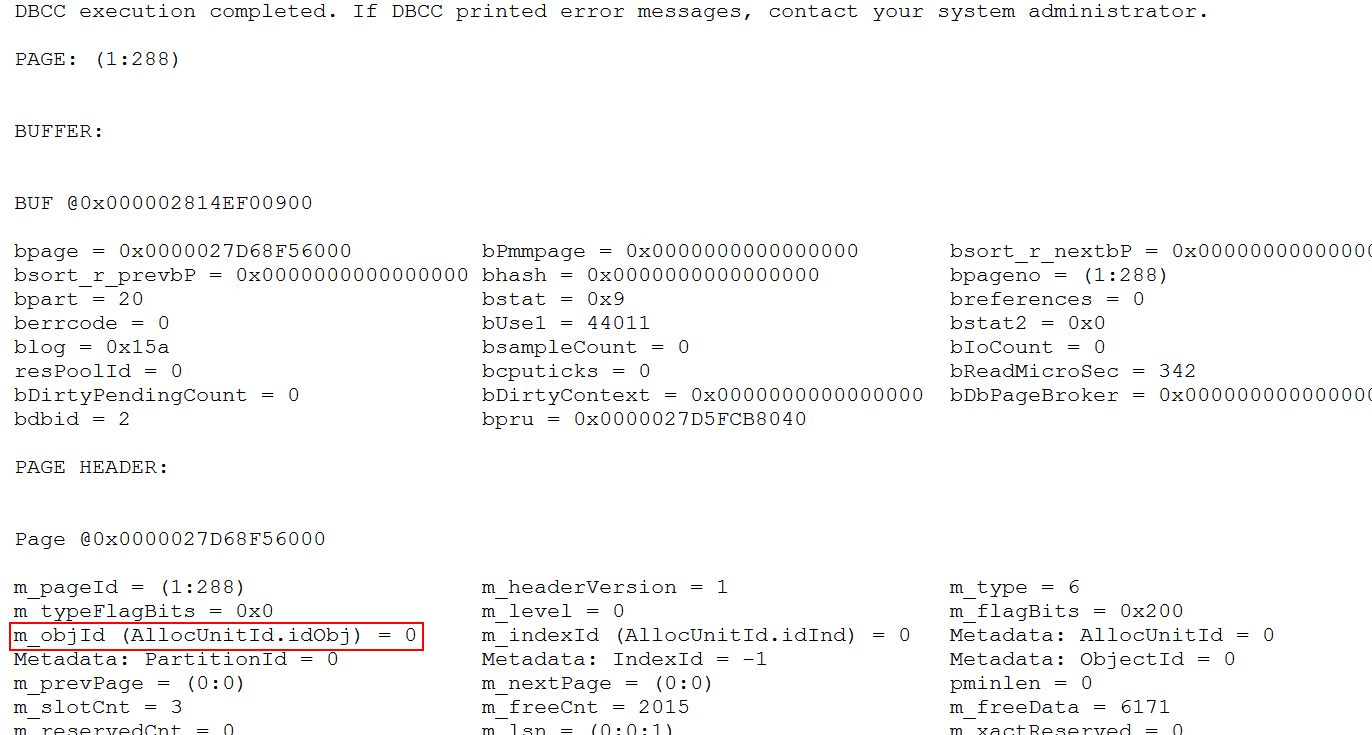
So far, this was all the same procedure that I also used for investigating the internal structures used by spool operators. But those operators use a worktable, which means that m_objId is not 0 but a negative value, and, more importantly, that the Metadata: PartitionId is a value that is actually relevant, and can be used to quickly find all other pages of the worktable once one has been found. A spilled Hash Match uses a workfile. They have a different structure. As you can see in the screenshot, they have zeroes in both m_objId and PartitionId, which means that there is no easy way to find the rest of the pages after finding one. We need to keep checking all the pages that were allocated after we started the spilling query.
After working through all potentially relevant pages on my system, I found a total of 17 pages with data that was easy to recognize as rows from the build input. I also found 7 pages that also has m_objId and PartitionId 0, but that were fully empty (zeroed out). I don’t know whether these are part of the hash table, perhaps as pre-allocated empty space, or whether these are completely unrelated to the hash table.
Page content
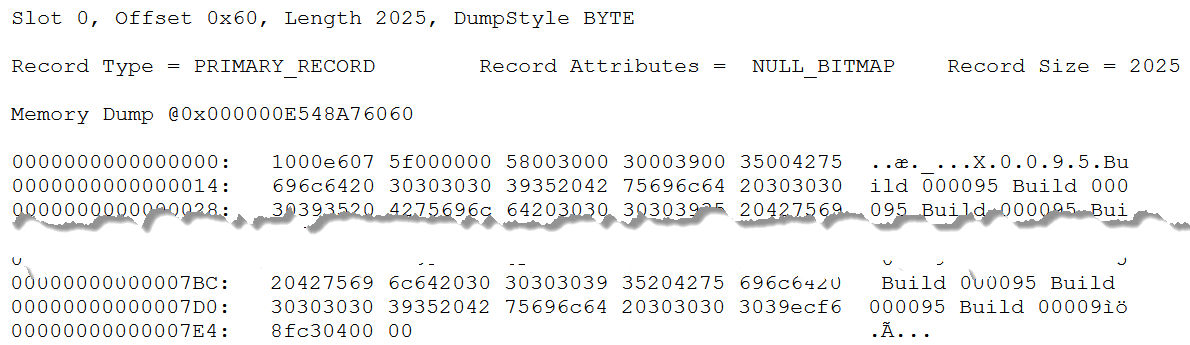
I already showed a screenshot of the first row on the first page with spilled data that I found. This is obviously the row with data for build row 95. But let’s look at the row in more detail, using the description of the structure here.
The TagA byte is 0x10, which means that only bit 4 is set. This record is a primary record (data row in a heap or clustered index), with a null bitmap, but no varying length data.
The TagB byte is 0x00: not a ghost forwarded record.
Bytes 3 and 4 show the offset of the null bitmap, which is always equal to the position of the number of columns. SQL Server uses little endian notation, which means that we need to start reading from the right-most byte. The value is 0x07e6, which corresponds to in decimal. In the screenshot above, I have cut out the middle part of the row, so that bytes 2022 and beyond are visible.
Bytes 2022 and 2023 are (again in little endian) 0x0004. There are four columns. With eight or less columns, the null bitmap is just a single byte, which is at the end of the record, in byte 2024. This byte is 0x00 – there are no null values in this row; all four columns hold actual values.
Bytes 5 to 2021 are then the fixed length part. There are four columns here, and it is quite easy to recognize two of them. Bytes 9 to 18 are the nchar(5) representation of the unicode string N’X0095′, which means that this is DataCol. Bytes 19 to 2018 are the char(2000) string that constantly repeats ‘Build 0095 Build 0095 … Build 009’ (which is where it is cut off); that is obviously CharCol.
That makes it easy to identify the other two fixed length columns. They must be the remaining parts: bytes 5 to 8, and bytes 2019 to 2022. Both are four bytes long. Bytes 5 to 8 store the value 0x0000005f, which is 95 in decimal. At four bytes, this is an integer, so this must of course represent the KeyCol column.
That leaves us with bytes 2019 to 2022, which holds the value 0xc38ff6ec (or 3,280,991,980 in decimal). What can this value be? There is no obvious relationship to the data in row 95. And yet, it is not hard to guess what this column represents. It is the result of whatever hash function SQL Server has applied to N’X0095′, the value in DataCol, the join column. Hash functions take a lot of CPU, so it makes sense that this value is stored, rather then recomputed when we read row back from tempdb into memory for further processing.
Summary
We now know exactly what is stored in the workfile that is created when Hash Match spills. For every spilled row, we found four columns. All three columns from the Build table, plus a fourth column, which is an integer column that I assume to be the result of the hash function, to prevent having to repeat the hash function.
I did not find anything to identify which pages in tempdb are for which partition. That is of course still relevant. After completing the first phase of the spilled Hash Match, where one partition is processed and the others are copied to tempdb, the other partitions are read back, one by one. It makes no sense to read through all pages, only to find which rows belong in the next partition. But since this mapping is not found on the pages in tempdb, we can conclude that SQL Server keeps keeps data in memory to identify which pages to read for each specific partition. That makes sense. This is a relatively small amount of data, and keeping it in prevents further slowdowns of the process.
Further options
If you want, you can of course do way more research, by modifying the code and then investigating the pages again.
You can create a much larger spill, and then create multiple locks on the Build table, that you then release one by one. If you then examine tempdb at every stage, you can get a lot of insight in the order in which the data is written to the data file.
You can also halt the process at a later stage of the probe phase. For instance, if you lock probe row 178 instead of 1, you will find more data in tempdb, because now the probe data for spilled partitions has also been written to tempdb. Again, using multiple blocked rows allows you to monitor how the data is written to tempdb during the process.
If you want 100% confirmation that this is indeed the hash value, and not some other unidentified data, then you can combine the approaches in part 3 of this series and this part to find a hash collision, and check whether those rows do indeed have the same value in this fourth column.
A very interesting and fun option is to change the data type of the join column. I found this way that for an integer column, the hash value seems to be just equal to that column itself. If you try other variations, then please leave a comment with your findings!
This concludes my blog series on the internals of a hash table. I hope you enjoyed this internals deep dive! My next blog post will, hopefully, be more relevant again to your daily query tuning work!


